
SaaS Subscription Analytics 2026: MRR, Churn and LTV Dashboard for SaaS Business
Do you run a SaaS product but track MRR in Excel, estimate churn in your head, and last checked LTV a quarter ago? Without a unified subscription metrics dashboard, it's impossible to tell whether your business is growing or slowly sinking. Investors and advisors ask for these numbers at every call.
Key facts
- Average B2B SaaS churn is 3.5% per year, but with monthly billing it's twice as high — a silent revenue killer
- LTV = ARPU / churn rate; reducing churn from 5% to 3% increases LTV by 66%
- Specialized tools (ChartMogul, Baremetrics) start at $49/month and require Stripe/Recurly integrations
- SimpleDashboard builds an MRR, churn and LTV dashboard in 5 minutes from a CSV export — no connectors needed
Our data shows that readers of "SaaS Subscription Analytics 2026: MRR, Churn and LTV Dashboard for SaaS Business" need a practical buying checkpoint, so this section separates subscription cost, migration risk, and day-to-day administration for the analitika-podpisok-saas scenario.
Comparison: How to Track Subscription Metrics?
| Method | Pros | Cons | Price |
|---|---|---|---|
| Excel / Google Sheets | Free, full control | Manual recalculation, no visualisation, errors | $0 |
| ChartMogul / Baremetrics | Auto-calculation from billing, benchmarks | Requires Stripe/Recurly connector, $49–200/mo | from $50/mo |
| Power BI / Tableau | Flexibility, enterprise level | Long setup, requires BI analyst | from $150/mo |
| AI Dashboard SimpleDashboard | Ready in 5 min from CSV, no connectors | No direct Stripe auto-sync | $50/mo |
How to Set Up a Subscription Metrics Dashboard in 3 Steps?
An MRR, churn and LTV dashboard can be built from any billing export — you just need a CSV with: date, user_id, plan, amount, subscription status.
Step 1. Prepare Your Data
Export transactions from Stripe, Paddle, or your internal CRM to CSV. You need: payment date, customer ID, plan, amount, status (active / cancelled). If data is scattered — consolidate it into a single table.
Step 2. Describe the Dashboard in Chat
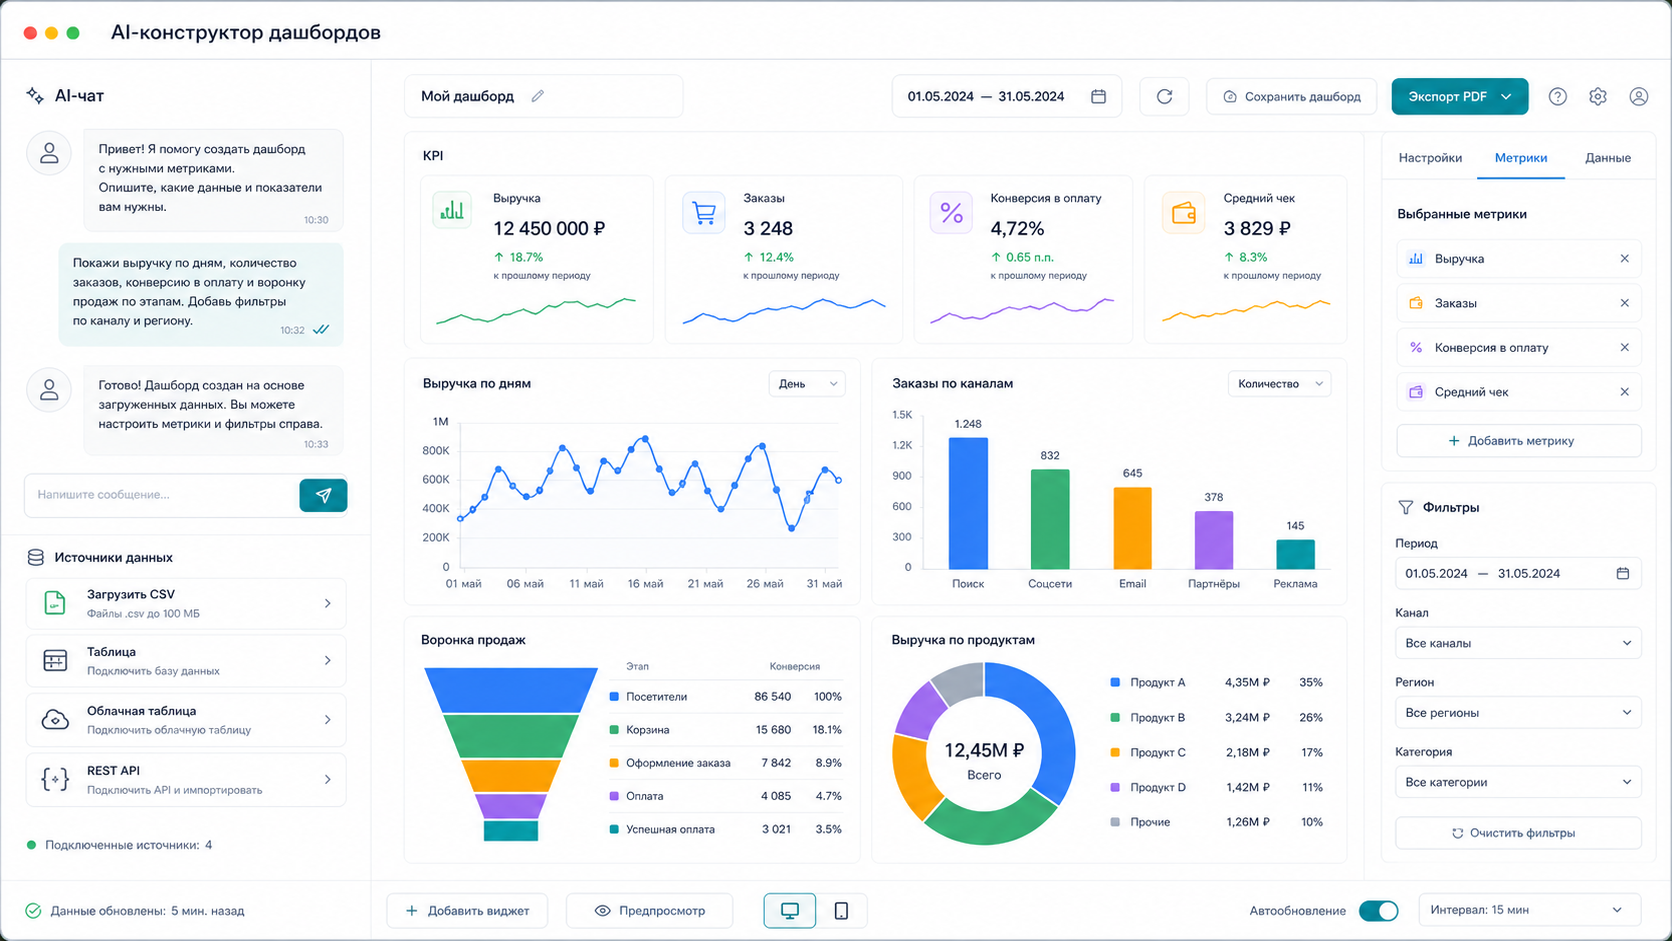
Open @coderboxbot and type: "Build a SaaS dashboard: MRR and ARR by month, monthly churn rate, LTV by plan, ARPU, cohort retention analysis, top-revenue plan". AI will select charts and KPI cards automatically.
Step 3. Get Your Analytics Ready
A dashboard with an MRR line chart, churn gauge, LTV cohort table, and ARR/ARPU KPI cards will be ready in 1–3 minutes. Share the link with investors or embed it in Notion.
What Else Can SimpleDashboard Do?
| Feature | What It Does |
|---|---|
| Cohort Analysis | Weekly and monthly retention in a heatmap |
| MRR Forecast | Trend line for 3–6 months based on current dynamics |
| Plan Segmentation | MRR and churn split by Starter / Pro / Enterprise |
| Auto-refresh | Data from API or webhook updates in real time |
See Also
- Sales Dashboard 2026: 7 Essential Metrics
- KPI Dashboard 2026: Monitoring Key Metrics
- Financial Dashboard 2026: Revenue, Expenses and Profit
- Sales Analytics 2026: How to Calculate KPIs
Frequently Asked Questions
How is MRR calculated in the dashboard?
MRR = sum of all active subscriptions for the current month. The dashboard shows New MRR, Expansion MRR and Churn MRR as separate colours on a stacked bar chart.
Can I load data from Stripe without an API?
Yes. Export payments from Stripe as CSV (Dashboard → Payments → Export) and upload the file to SimpleDashboard. No API connector is required.
What is a normal churn rate for a SaaS startup?
In 2026, 5–7% per month is normal for early stages, 3–5% for growth stage. The dashboard shows your churn rate against these benchmarks.
Do I need a developer to set it up?
No. You describe the metrics you need in chat — AI builds the dashboard in plain language, without SQL or a BI analyst.
Stop guessing whether your SaaS is growing. SimpleDashboard builds an MRR, churn and LTV dashboard in 5 minutes — no connectors, no developer, no weeks of BI setup.
Price — $50/mo. Message @coderboxbot — we'll build a dashboard for your data.
Learn more about features on the SimpleDashboard page.
Article prepared by the SimpleDashboard team. Updated: March 2026.
Sources: - https://www.carrotquest.io/blog/shpargalka-metriki-dlya-saas-servisov/ - https://billogic.ru/blog/dengi-lyubyat-schyot-razbiraem-klyuchevye-metriki-podpisochnogo-biznesa-mrr-i-arpu/ - https://www.mrrsaver.com/blog/saas-churn-rate-benchmarks - https://chartmogul.com/ - https://www.hubifi.com/blog/saas-analytics-dashboard-guide - https://vc.ru/marketing/94668-6-samyh-vazhnyh-metrik-dlya-saas-biznesa
Created with AI tool support for outline and consistency checks; reviewed by Alexander Ruin, founder of onout.org for onout.org. Updated: 2026-05-01.
About the service "SaaS Subscription Analytics 2026: MRR, Churn and LTV Dashboard for SaaS Business"
Build a subscription metrics dashboard — MRR, ARR, churn, LTV, ARPU — in 5 minutes. For SaaS startups and product managers. No BI analyst needed. 50 USDT/month.