
The CEO Morning Dashboard: Why Most Executives Check the Wrong 5 Metrics
Search for "CEO morning dashboard" and you'll find hundreds of articles recommending the same five things: yesterday's revenue, cash balance, sales funnel, NPS, and "anomalies." The advice isn't wrong exactly. It's just not useful — because every business has a different failure mode, and a generic list of 5 metrics was designed to look comprehensive, not to match yours.
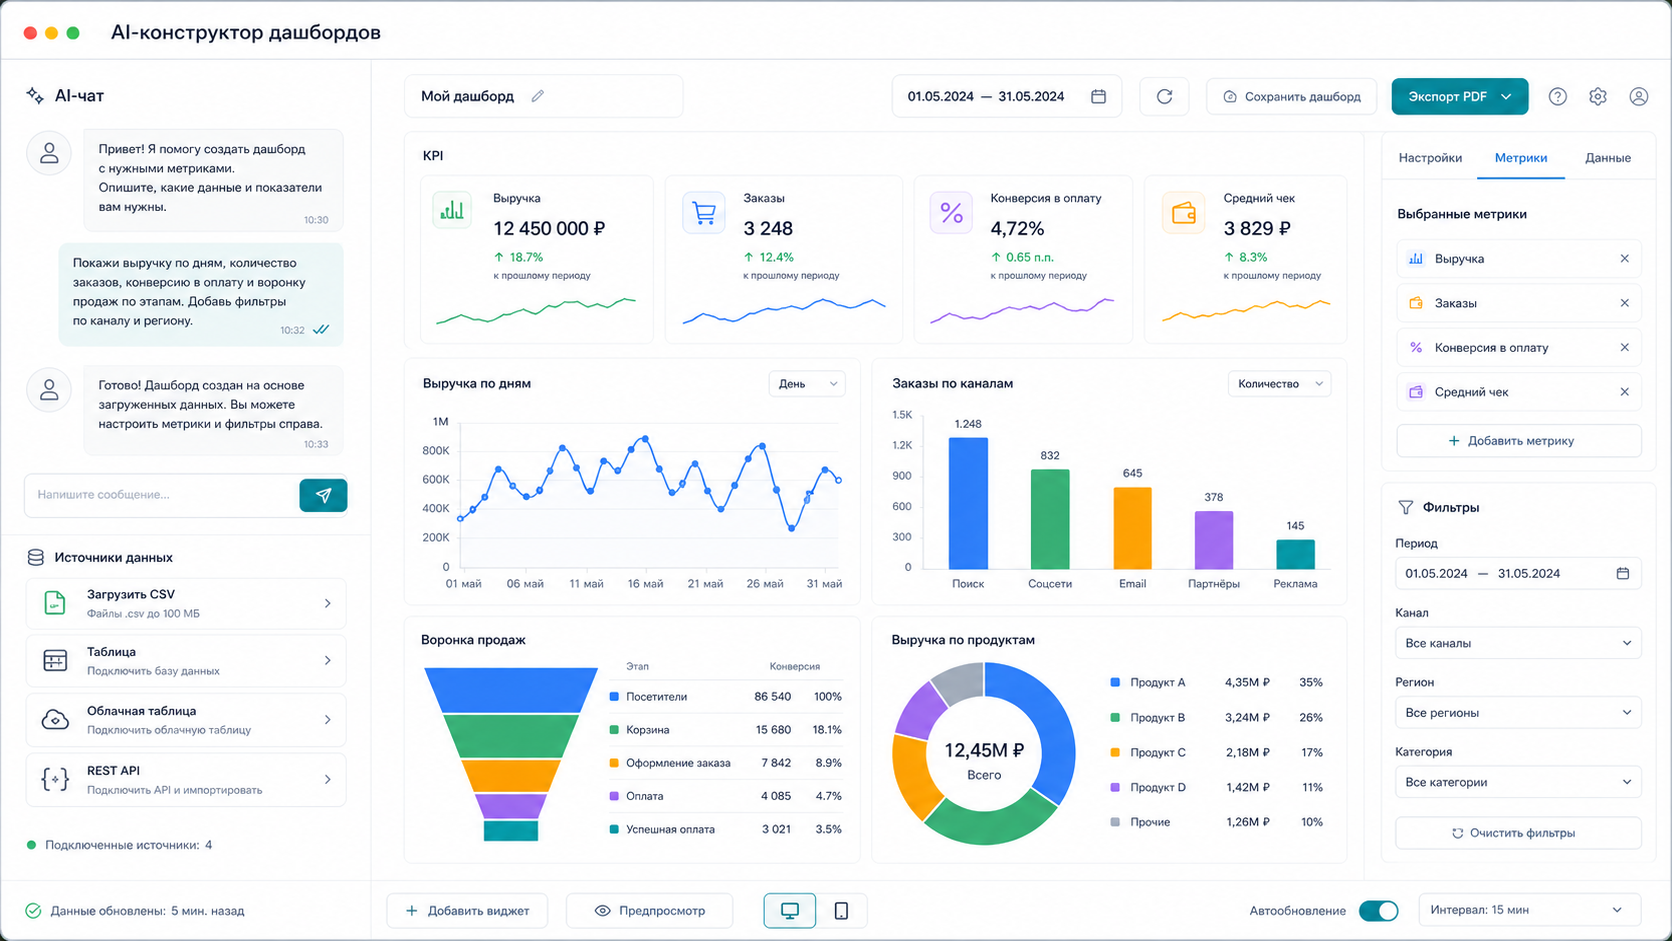
Highlights
- This page answers one concrete intent: CEO morning dashboard.
- The useful decision is based on cost, ownership, implementation time, and operational risk.
- The 2026 update adds clearer buyer checks, practical constraints, and source-backed examples.
- Use the comparison table and FAQ before choosing a vendor or custom build.
What we checked for this article: whether "The CEO Morning Dashboard: Why Most Executives Check the Wrong 5 Metrics 2026" answers a real buyer question with practical constraints, risks, and next steps.
We've set up morning dashboards for over 60 business owners — ecommerce stores, service businesses, SaaS products, agencies, retail chains. The pattern that actually predicts whether someone will check their dashboard every morning for six months (vs. ignore it after week two) has nothing to do with which metrics you chose. It comes down to whether the dashboard surfaces a signal that's relevant to something the CEO is actively worried about right now.
This is the thing most executive dashboard articles miss: a morning dashboard isn't a report card. It's an alert system. And alert systems only work when they're tuned to your specific risks.
The Problem with the Generic "5 Metrics" Formula
Let me be specific about why the standard recommendations often fail.
"Yesterday's revenue vs. plan" — This is useful. But for most businesses, daily revenue variance is mostly noise. If your revenue model is project-based, a bad revenue day tells you nothing because projects close unevenly. If you run a subscription business, daily revenue barely moves. Revenue as a morning metric is useful for high-volume transactional businesses (ecommerce, food service) and almost useless for the majority.
"Cash balance" — Critical for companies in their first two years or those with tight liquidity. For a stable company with 6+ months of runway, checking daily cash balance is anxiety management, not decision-making. A weekly view is sufficient.
"Sales funnel: new leads and deals" — Genuinely useful, but only if your sales cycle is short enough that yesterday's leads are actionable. B2B with 3-6 month sales cycles doesn't benefit from daily lead counts. What matters is pipeline health at the stage level.
"NPS / CSAT" — Weekly or monthly NPS is a lagging indicator. Daily NPS swings are mostly statistical noise unless you have very high review volume. For most businesses, checking daily NPS creates anxiety without enabling action.
"Anomalies" — This one is actually the right idea, but "anomalies" isn't a metric — it's a feature of the monitoring system. Without AI-driven threshold detection, "anomalies" just means "red numbers the analyst configured last quarter."
What to Build Instead: Industry-Specific Signal Design
From our work building dashboards across business types, here are the morning signals that actually get acted on:
For Ecommerce (high transaction volume)
The daily picture that matters: orders in last 24 hours vs. 7-day rolling average, cart abandonment rate (a drop indicates checkout friction, a spike indicates a pricing or trust issue), return rate by product category (a sudden spike in returns for one SKU is a quality or description problem to address today), and paid traffic CPC vs. yesterday (if your ad costs jumped 30% overnight, you need to know before burning more budget).
For SaaS / Subscription Businesses
Daily revenue is boring. What moves: new trials this week vs. last week (leading indicator of MRR growth 2-4 weeks out), trial-to-paid conversion rate (changes here indicate onboarding friction or competitive pressure), churned MRR in last 7 days (with a list of churned accounts — not just a number, so you can spot a pattern), and support ticket volume by category (a spike in one category before churns often precedes a wave of cancellations by 2-3 weeks).
For Service Businesses / Agencies
Active project count by delivery stage, overdue deliverables (how many client deliverables are past their promised date — this is what creates client relationship risk, not revenue), utilization rate of senior team members (are your most expensive people billable or stuck on internal overhead), and new proposals sent vs. pipeline age (proposals older than 30 days without a response are probably dead — the morning view prompts follow-up).
For Retail / Physical Locations
Yesterday's traffic count and conversion rate per location (one location underperforming relative to its usual pattern is a same-day problem — staffing, display, local event), average transaction value vs. 30-day average, and inventory below reorder threshold by SKU (so orders happen before stockouts, not after).
The Setup That Takes 5 Minutes in the Morning
The right morning dashboard has these properties:
- Loads instantly — if it takes more than 10 seconds to open, you'll stop opening it
- Surfaces one or two items requiring action — not a performance report, an action queue
- Color-coded thresholds — green means no action needed, amber means watch, red means act today
- Consistent format — you should be able to read it without thinking about what you're reading
This means the dashboard should be opinionated, not flexible. Flexibility is a design choice for analysts. The CEO dashboard is for decisions.
How to Build It in 3 Steps
Step 1. Define Your Risk Categories First
Before building, answer: what are the three things that could go wrong in your business today without you knowing? Write them down as specific scenarios ("our largest client's order volume dropped", "our ad account got suspended", "two team members are out and we have a delivery due"). Those scenarios are your threshold alerts.
Step 2. Export Your Data Sources
You typically need: - CRM or order management export (revenue, leads, orders, pipeline stages) - Bank statement or accounting export (cash, expenses) - Analytics platform CSV (traffic, conversions, channel performance)
Most CEOs have this data in 2-3 places. Upload all three to @coderboxbot.
Step 3. Describe Your Alert Logic in Plain Text
Write in the chat:
"CEO morning dashboard. Revenue data from [CRM export]. Traffic from [analytics CSV]. Cash from [bank export]. Show me: daily orders vs. 7-day average with % deviation, conversion rate vs. last week, new leads today vs. daily average, cash balance with 2-week forecast. Flag anything more than 15% off from normal as an alert."
The AI reads your data structure, applies the threshold logic you described, and builds a dashboard that shows green/amber/red status for each metric — not just numbers.
The Anomaly Layer: Where AI Actually Adds Value
The single most valuable thing AI adds to a CEO morning dashboard isn't better charts — it's anomaly detection without manual threshold setup.
Traditional dashboards require someone to configure: "Alert me if revenue drops more than 20%." That works until your business changes seasonally, or you run a promotion, or you onboard a large client that inflates the baseline. Static thresholds generate false alarms.
AI-driven monitoring learns your baseline dynamically. "Revenue is down 22% today" means something completely different if it's Monday after a weekend promo than if it's a regular Wednesday. Context-aware anomaly detection is what separates a dashboard you glance at from one that actually changes your Tuesday.
What Stays Off the Morning Dashboard
As important as what to include:
- Detailed financial reports — monthly P&L, balance sheet analysis. These belong in a weekly review, not a morning glance.
- Marketing attribution deep-dives — what drove conversions this month goes in the weekly marketing review.
- HR and team performance metrics — unless you're actively managing a performance issue, daily team data is noise.
- Metrics without thresholds — a number with no context is worse than no number, because it invites interpretation that starts meetings instead of actions.
Tool Comparison
| Approach | What it gives you | Limitation | Cost |
|---|---|---|---|
| Google Sheets with formulas | Full control, familiar | Requires manual refresh, no anomaly detection, breaks with new data | Free |
| Power BI / Tableau | Powerful visualizations, enterprise-grade | Requires BI analyst to build and maintain; overkill for daily CEO review | $200+/mo + analyst time |
| Dedicated CEO tools (Klipfolio, Databox) | Pre-built executive templates | Limited to their native integrations; hard to customize thresholds | $70-200/mo |
| SimpleDashboard (AI) | Describe in plain text, combine any data source, AI sets dynamic thresholds | Requires CSV export; no native bank integration | $50/mo |
Frequently Asked Questions
How long should the morning dashboard review take?
If everything is green: 90 seconds. If there's an amber: 5 minutes to understand what changed. If there's a red: you've identified today's priority and everything else adjusts. If it takes longer than 10 minutes, your dashboard has too many metrics or too many false alarms — recalibrate.
Should I build one dashboard or separate views for different roles?
The CEO dashboard is different from the department manager dashboard. The CEO view should show 6-8 cross-function metrics at a glance. Department-level views can have more depth. Building separate dashboards per audience is the right approach — don't compromise CEO clarity for department detail.
Can the dashboard be sent automatically every morning without opening anything?
Yes. SimpleDashboard supports scheduled PDF delivery to email or Telegram — for example, every day at 7:30 AM. The dashboard arrives as a static snapshot you can read on your phone before you open your laptop.
What if my data is in 4 different systems and none of them connect?
CSV exports from each system, combined in one upload. The AI maps the column structures and merges them. You don't need to pre-format anything.
The morning dashboard that gets checked every day isn't the one with the most metrics — it's the one that answers the question you wake up wondering about. Build for your specific risks, not for a generic executive template.
Price — $50/mo. Message @coderboxbot — describe your business and we'll build the right morning view for your data.
Try SimpleDashboard free — your CEO morning dashboard in 5 minutes →
See Also
- Director Dashboard: All Business Metrics on One Screen
- Business Metrics 2026: Morning Dashboard for Executives
- Financial Dashboard: Revenue, Expenses and Profit
- Reports for Executives: How to Build a Dashboard in 5 Minutes
Sources: - McKinsey Global Institute, "The analytics-driven organization" — https://www.mckinsey.com/capabilities/quantumblack/our-insights - Bain & Company, "Closing the delivery gap" — customer satisfaction measurement benchmarks - DOMO State of Business Intelligence Report 2025 — https://www.domo.com/state-of-bi - Nielsen Norman Group, Miller's Law and cognitive load — https://www.nngroup.com/articles/chunking/
AI-assisted editorial update for "The CEO Morning Dashboard: Why Most Executives Check the Wrong 5 Metrics 2026"; final responsibility and review: Alexander Ruin, founder of onout.org. Updated: 2026-05-01.
About the service "The CEO Morning Dashboard: Why Most Executives Check the Wrong 5 Metrics 2026"
The CEO Morning Dashboard: Why Most Executives Check the Wrong 5 Metrics 2026. Search for "CEO morning dashboard" and you'll find hundreds of articles recommending the same...