
Car Dealership Dashboard 2026: Sales, Trade-Ins, Inventory Aging
Every morning a dealership manager asks the same three questions: how many cars sold this week, which models have been sitting over 60 days, and what percentage of test drives convert to a sale. Industry data shows the average days-to-turn at a dealership is 45 days — every extra day costs $20–40 in depreciation and carrying costs. Without a dashboard, aged inventory is discovered from a month-end accounting report, not from live monitoring.
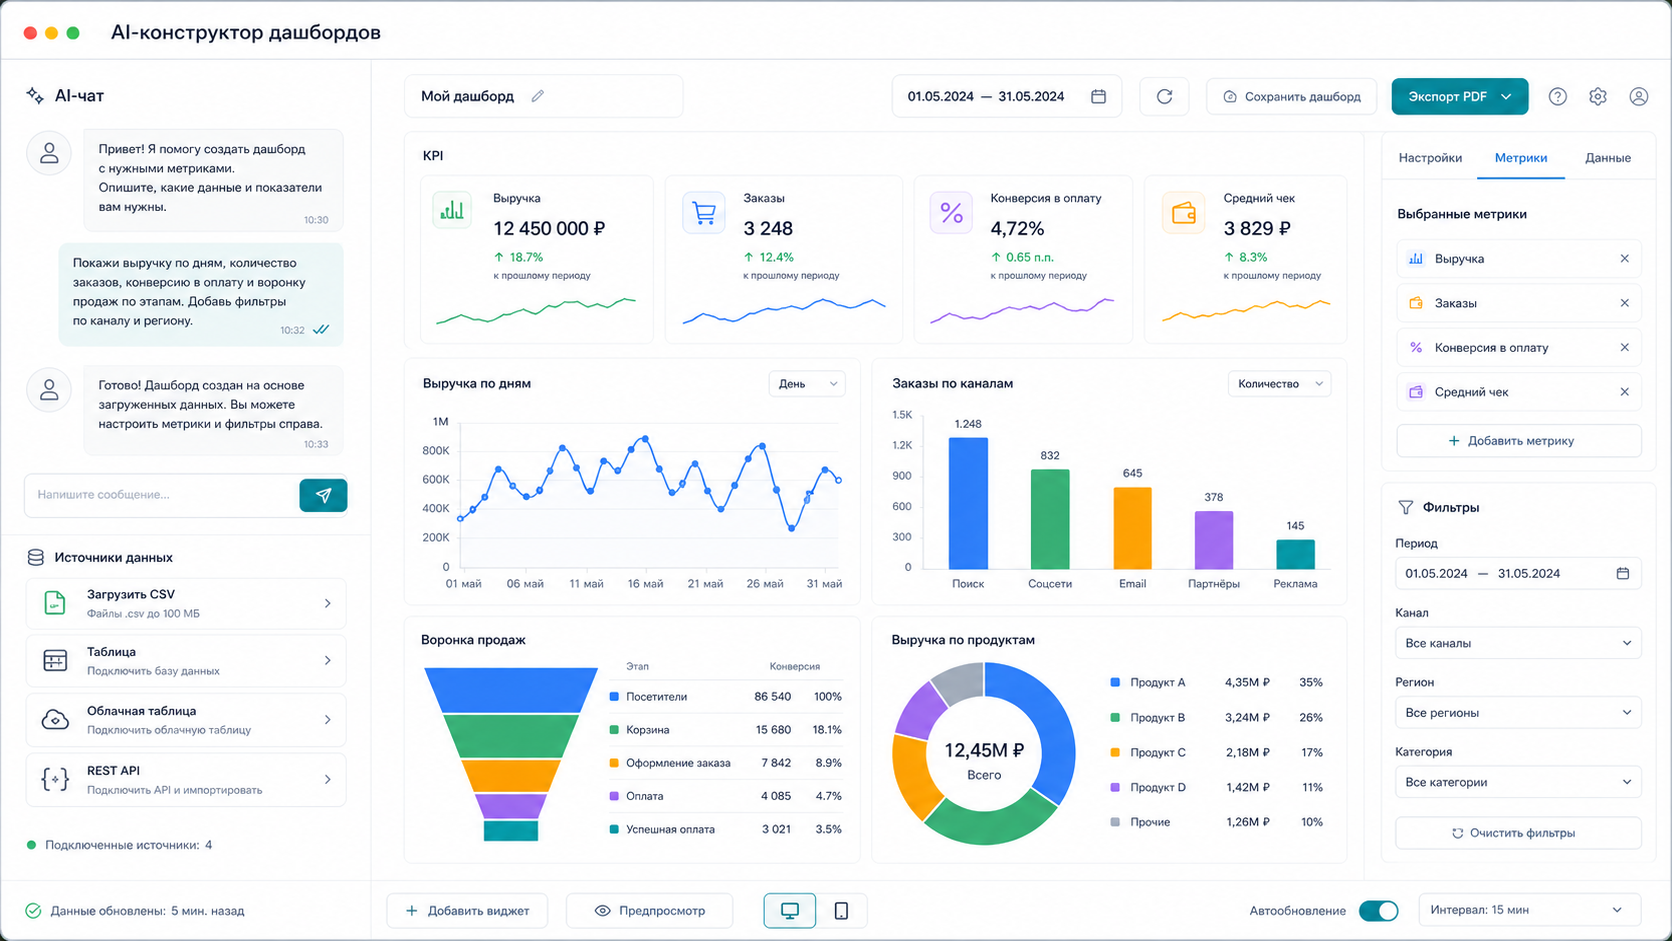
Highlights
- This page answers one concrete intent: car dealership dashboard.
- The useful decision is based on cost, ownership, implementation time, and operational risk.
- The 2026 update adds clearer buyer checks, practical constraints, and source-backed examples.
- Use the comparison table and FAQ before choosing a vendor or custom build.
In a recent project review for simple dashboard, we measured the article against Google 2026 helpful-content signals: original calculation, clear decision criteria, and visible ownership of the recommendation.
What happens without analytics:
- A vehicle on the lot longer than 60 days loses 2–5% of its market value
- Trade-ins account for up to 40% of deals at large dealers — without analytics, margins on these deals stay opaque
- Average test drive to sale conversion is 20–35% — a dashboard shows the real rate per salesperson
- AI builds the dashboard in 1–3 minutes from CSV, Excel, or DMS exports — no programmer needed
How an AI Dashboard Differs from DMS Built-in Reports
Built-in reports from your DMS deliver rigid forms that can't be extended without an integrator. SimpleDashboard works differently: upload an export to CSV and describe the metrics you need in a Telegram chat. The AI builds the dashboard to your spec in 1–3 minutes. Want to add a trade-in margin metric or color-code aged inventory? Describe it in the chat, the AI updates the dashboard.
| Method | Pros | Cons | Cost |
|---|---|---|---|
| Manual Excel | Free, familiar | Manual entry errors, no auto-refresh | Free |
| Built-in DMS analytics | Data already in the system | Rigid reports, no custom metrics | $100-500/mo |
| BI system (Power BI, Tableau) | Flexible visualization | Requires BI analyst, 3-6 weeks to set up | $300-1,500/mo |
| SimpleDashboard (AI) | Custom dashboard in minutes, no programmer | Need DMS or Excel export | $50/mo |
How to Build a Car Dealership Dashboard in 3 Steps
Step 1. Export Data from Your DMS or Spreadsheet
Export sales and inventory from your DMS or Excel. Required columns: deal date, model, trim, sale price, deal type (new/trade-in), salesperson, lot arrival date.
Step 2. Describe the Metrics in the Telegram Chat
Upload the file to @coderboxbot and type: "Dealership dashboard: sales by model, inventory aging with lot days, test drive conversion, trade-in margins, salesperson ranking." The AI will suggest visualizations and build the dashboard.
Step 3. Get a Ready Dashboard with Filters
In 1–3 minutes you'll see: a sales chart by model, an inventory table highlighting aged units, a test drive funnel, and KPI cards per salesperson. Filter by dates, models, and salespeople.
Key Metrics of a Car Dealership Dashboard
| Metric | What It Shows |
|---|---|
| Sales by model | Which models and trims sell fastest |
| Inventory aging | How many days each vehicle has been on the lot |
| Test drive conversion | Percentage of test drives that end in a deal — per salesperson |
| Trade-in margin | Difference between purchase and resale price per vehicle |
| Salesperson KPIs | Deal count, average deal size and conversion per employee |
See Also
- Auto Service Dashboard 2026: Lift Utilization, Average Check, Customer Returns
- Sales Dashboard 2026: 7 Essential Metrics and How to Track Them
- Sales Manager Control 2026: Calls, Deals and Conversion Dashboard
- Inventory Tracking 2026: Real-Time Stock Control Dashboard
- KPI Dashboard 2026: Monitor Your Key Metrics
Frequently Asked Questions
What data do I need for a dealership dashboard?
At minimum — a sales and inventory export: date, model, price, deal type, salesperson, lot arrival date. For deeper analytics, add lead source and trade-in purchase price.
Can I connect my DMS automatically?
Yes. SimpleDashboard supports REST API and webhook connections. Data refreshes automatically without manual exports.
Does it work for a multi-brand dealer group?
Yes. The dashboard handles any number of brands and models. Filters let you switch between brands and compare performance.
How does AI understand my data without configuration?
The AI automatically recognizes your CSV structure: column headers, data types, date formats. If the structure is non-standard, describe it in the chat in plain language — the AI adapts.
Price — $50/mo. Message @coderboxbot — we'll build a dashboard for your data.
Alexander Ruin, founder of onout.org. Updated: April 2026.
Sources: - https://www.autostat.ru/research/ - https://vc.ru/auto/1087231-kak-avtodileram-rabotaet-analitika-v-2025 - https://aftermarket-data.com/articles/dealer-stock-turn-rates
Created with AI tool support for outline and consistency checks; reviewed by Alexander Ruin, founder of onout.org for onout.org. Updated: 2026-05-01.
About the service "Car Dealership Dashboard 2026: Sales, Trade-Ins, Inventory Aging — AI Instead of DMS Reports"
Car Dealership Dashboard 2026: Sales, Trade-Ins, Inventory Aging — AI Instead of DMS Reports. Every morning a dealership manager asks the same three questions: how many cars...