
Ecommerce Dashboard 2026: Orders, Conversion, AOV and Returns — No Analyst Needed
CSV exports pile up in a folder. Your team can't see what's happening right now. GA4 needs a specialist to make sense of it. The marketer spends half a day building weekly pivot tables. This isn't a data problem — it's a tooling problem.
Key takeaways
- This page answers one concrete intent: dashboard for ecommerce.
- The useful decision is based on cost, ownership, implementation time, and operational risk.
- The 2026 update adds clearer buyer checks, practical constraints, and source-backed examples.
- Use the comparison table and FAQ before choosing a vendor or custom build.
During rollout planning for simple dashboard, the recurring issue was not feature quantity but whether a buyer could verify limits, exports, integrations, and ownership before committing.
The global average ecommerce conversion rate is 1.89%; optimized stores reach 2.5–3% (IRP Commerce, 2026). A 1% difference at 10,000 monthly visitors means +110 orders per month. That's the gap between "managing by feel" and "seeing numbers every day."
What happens without a dashboard:
- Returns reach 15–30% in apparel and electronics — without monitoring they silently compress margins for weeks
- Average order value drops three weeks in a row — nobody notices until accounting sends the month-end report
- Which ad channel brings profitable buyers versus chronic returners — unknown
Comparing Tools for Ecommerce Analytics
| Tool | Strengths | Weaknesses | Cost |
|---|---|---|---|
| GA4 | Traffic, funnel, events | No CRM orders, returns — requires extra setup | Free + specialist |
| Metrica/Analytics | Traffic, heatmaps | No financial metrics, no inventory data | Free + configuration |
| Power BI | Any data, flexible | 2-5 days setup, needs BI analyst | $165+/mo |
| SimpleDashboard | Orders + conversion + AOV + returns from CSV/API in one place | No competitor intelligence | $50/mo |
3 Steps to an Ecommerce Dashboard
Step 1. Prepare Your Data
Export a CSV or Excel from your CMS/CRM: orders, statuses, amounts, traffic channels, returns. Any format works — Shopify, WooCommerce, Magento, Salesforce. Or connect REST API for auto-updates.
Step 2. Describe the Metrics in the Chat
Open @coderboxbot and write: "Load my orders export, build KPIs for revenue, AOV, conversion rate and returns over the last 30 days, with a breakdown by traffic channel." No SQL — just plain text.
Step 3. Get a Live Dashboard
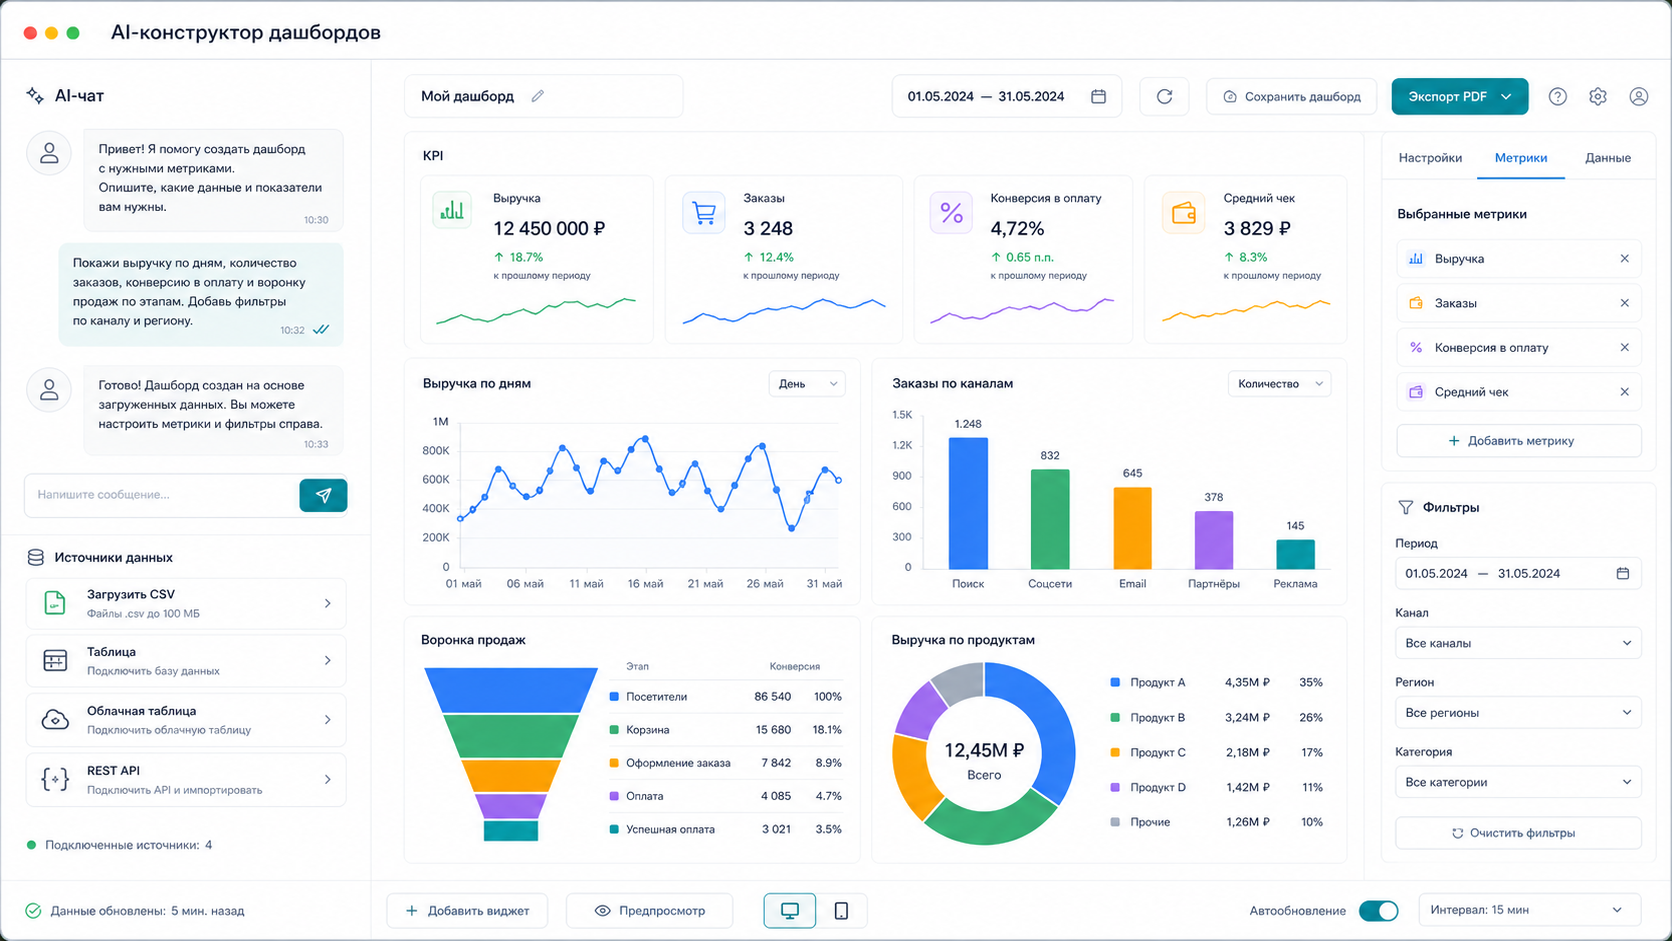
The AI builds a dashboard with KPI cards, daily order chart, sales funnel, returns breakdown, and filters. Data is stored on your own server — not in a third-party cloud.
Key Ecommerce Dashboard Metrics
| Metric | Why It Matters |
|---|---|
| Daily revenue | Trend and seasonality — in real time, not after the fact |
| Conversion rate | % of visitors who ordered — by traffic channel |
| Average order value (AOV) | Trend — when and why it drops |
| Return rate | By SKU and category — where margin gets eaten |
| Channel breakdown | Which channel brings profitable buyers vs. returners |
See Also
- End-to-End Analytics 2026: From Ad Click to Sale
- Sales Dashboard: 7 Essential Metrics
- CRM Analytics Dashboard: Sales Reports Without a BI Analyst
- KPI Dashboard 2026: Monitor Your Key Metrics
Frequently Asked Questions
What metrics are essential for an ecommerce dashboard?
Minimum set: revenue, order count, AOV, visitor-to-order conversion, return rate, weekly trend. This is enough for daily management oversight.
How is an AI dashboard better than built-in CMS analytics?
Your CMS only sees its own data. An AI dashboard combines orders from your CMS, traffic from GA4, returns from your CRM, and financials on one screen — no manual Excel merging.
Do I need a developer?
No. Upload a CSV from your CMS back-office — the dashboard is ready in 5 minutes.
Can I see returns broken down by reason?
Yes. If your export includes a "return reason" field, AI builds a chart and ABC-analysis of returns by SKU.
Price — $50/mo. Message @coderboxbot — we'll build a dashboard for your data.
Alexander Ruin, founder of onout.org. Updated: April 2026.
Sources: - https://vwo.com/blog/important-ecommerce-metrics/ - https://www.bigcommerce.com/articles/ecommerce/ecommerce-metrics/ - https://blendcommerce.com/blogs/shopify/ecommerce-conversion-rate-benchmarks-2026
This simple_dashboard guide uses AI-assisted drafting and human editorial review by Alexander Ruin, founder of onout.org. Updated: 2026-05-01.
About the service "Ecommerce Dashboard 2026: Orders, Conversion, AOV and Returns — No Analyst Needed"
Ecommerce dashboard without SQL: orders, conversion rate, AOV, returns in real time. AI builds from CSV/API in 5 minutes. Data on your server. $50/mo.