
Logistics Dashboard 2026: Track Deliveries, Fleet Utilization & Cost per Km
Dispatchers drown in spreadsheets: trip statuses in Excel, mileage data in the TMS, invoices in messengers. The director can't see route profitability in real time — cost per km only appears in the end-of-month accounting report. According to McKinsey, transport companies waste up to 30% of operational time manually collecting data instead of managing shipments.
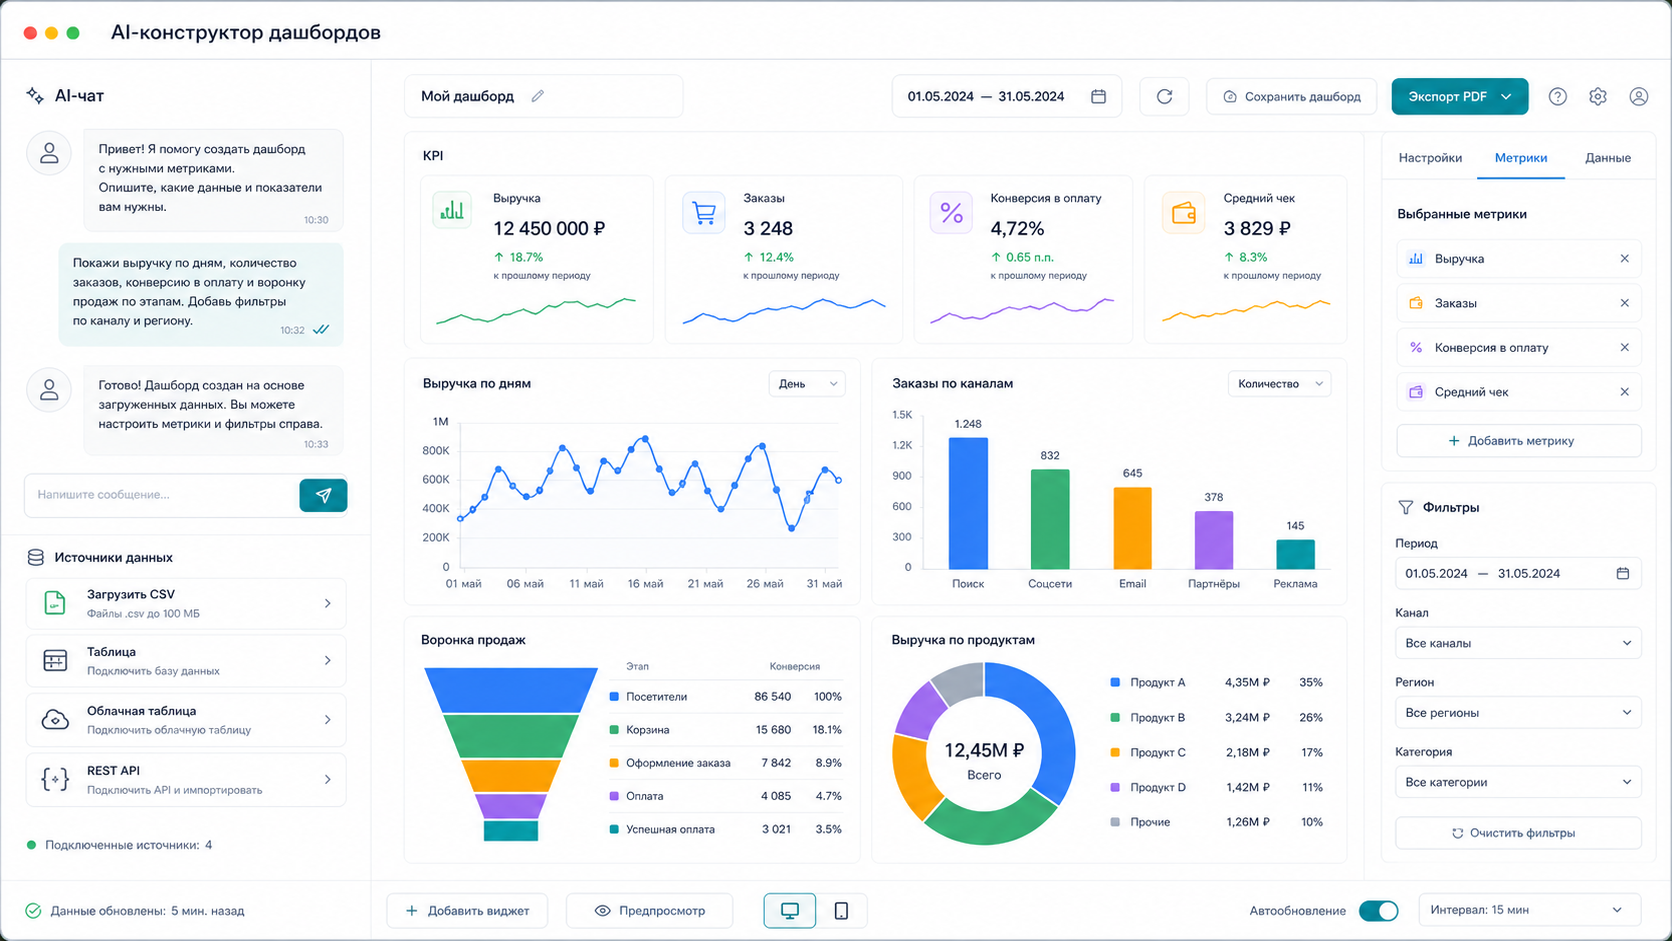
Key facts
- Transport companies waste up to 30% of operational time manually collecting data (McKinsey)
- Dispatchers and directors need different metrics — operational and financial — on one screen
- SimpleDashboard builds a logistics dashboard in 3-5 minutes from CSV, Excel or TMS/ERP exports
- Auto-update on new file upload or via API — no manual data copying
What we checked for this article: whether "Logistics Dashboard 2026: Track Deliveries, Fleet Utilization & Cost per Km" answers a real buyer question with practical constraints, risks, and next steps.
Key Metrics for a Logistics Dashboard
| Metric | What it shows | Visualization |
|---|---|---|
| Delivery statuses | In transit / delivered / delayed / cancelled | Color-coded table |
| Fleet utilization | % fleet usage, empty mileage | Gauge + bar chart |
| Cost per km | Gross revenue / total fleet mileage | KPI card with trend |
| Avg transit time | Actual vs plan by route | Line chart |
| Route profitability | Revenue minus cost by direction | Horizontal bar chart |
| Loading time | Avg time at pickup/delivery point | Grouped table |
Tool Comparison
| Tool | Setup time | Specialist needed | Auto-update | Cost |
|---|---|---|---|---|
| Excel | 5-15 h/week | Pivot table skills | No | Free |
| TMS / ERP | 2-8 weeks | Implementation partner | Yes | from $1,000 one-time |
| SimpleDashboard | 3-5 min | None | Yes | $50/mo |
3 Steps to a Logistics Dashboard
Step 1. Upload your trip data
Send SimpleDashboard an export from your TMS, ERP, or Excel: trips, mileage, statuses, routes. The AI automatically recognizes columns — date, vehicle, route, distance, status, cost.
Step 2. Describe the dashboard in plain text
Write to the bot:
"Logistics dashboard: today's delivery statuses, fleet load by day, cost per km by route, top-5 most profitable directions"
The AI selects the right visualizations: a color-coded status table, a utilization gauge, and a cost-per-km trend line.
Step 3. Get your dashboard
In 1-3 minutes you receive a link to an interactive panel: - Operational screen for dispatchers — live delivery statuses - Analytics for the director — route profitability, cost-per-km dynamics - Filters — by vehicle, driver, route, period - Auto-update on new file upload or via API
See Also
- CEO Dashboard: all business KPIs on one screen
- Warehouse Management: simple program without ERP
- Financial Dashboard: revenue, costs and profit
FAQ
Can I connect GPS trackers or a TMS to the dashboard?
Yes. If your system exposes a REST API, the dashboard updates automatically. If not, a daily CSV/Excel export is enough — the AI merges data from multiple files into a single panel.
How is cost per km calculated?
Formula: gross revenue for a trip / actual vehicle mileage. You need a file with columns: trip, amount, mileage. The AI derives cost/km per route and plots the trend automatically.
Does it work for a small fleet (5-20 vehicles)?
Yes — that is the ideal size. No corporate TMS required; a waybill spreadsheet in Excel is enough.
A logistics dashboard in 2026 is not a month-long implementation project. SimpleDashboard turns waybill spreadsheets and TMS exports into a working panel for dispatchers and directors — in minutes.
Price — $50/mo. Message @coderboxbot — we'll build a dashboard for your data.
Learn more about all features on the SimpleDashboard page.
SimpleDashboard Team. Updated: 2026-03-13.
Sources: - Power BI dashboard for logistics analysis — innervate.ru - Logical dashboards for SIBUR logistics department — up-pro.ru - CARGO.RUN — key metrics for a transport company dashboard — cargorun.ru - Transport logistics optimization: load and routes — zig-zag.org
AI-assisted editorial update for "Logistics Dashboard 2026: Track Deliveries, Fleet Utilization & Cost per Km"; final responsibility and review: Alexander Ruin, founder of onout.org. Updated: 2026-05-01.
About the service "Logistics Dashboard 2026: Track Deliveries, Fleet Utilization & Cost per Km"
Build a logistics dashboard in minutes — no SQL, no BI analyst. Delivery statuses, fleet load, cost per km on one screen. Compare Excel, TMS and AI builder.