
Medical Clinic Dashboard 2026: Doctor Utilization, Appointment Conversion, Revenue per Service
A head physician at a multi-specialty clinic discovers problems only after the fact: the surgeon is booked at 110%, therapists sit in empty offices, and the conversion of primary patients to repeat visits has dropped from 62% to 48% — yet this only surfaces in the accounting report at month's end. Analytics from MEDIALOG, Infoclinica, or 1C-Medicine exists, but it is scattered across dozens of forms with no unified view.
Key facts
- Average physician utilization in private Russian clinics is 65-75%: dropping below 60% signals a scheduling or marketing problem
- Primary-to-repeat patient conversion below 50% signals a systemic issue in the patient journey
- MEDIALOG, Infoclinica, and 1C-Medicine all support CSV/Excel exports — enough to build a complete dashboard without a programmer
- SimpleDashboard builds a clinic dashboard in 1-3 minutes without a BI analyst
What we checked for this article: whether "Medical Clinic Dashboard 2026: Doctor Utilization, Appointment Conversion, Reve…" answers a real buyer question with practical constraints, risks, and next steps.
How Clinics Handle Analytics in 2026
Most clinic managers start with Excel and built-in HIS reports. As departments multiply, reports are assembled by hand — and the head physician gets numbers a month late.
| Method | Pros | Cons | Cost |
|---|---|---|---|
| Built-in HIS reports (MEDIALOG, Infoclinica) | Data is already there | No conversion funnel, monthly cadence only | $0 extra (included in HIS) |
| Excel manually | Free, familiar | 4-8 hours/week, errors, no real-time view | Free |
| BI system (Power BI, DataLens) | Powerful analytics | Needs a BI analyst, 3-6 weeks to set up | from $300 + specialist |
| SimpleDashboard (AI) | Describe in plain language — ready in minutes | Requires HIS data export | $50/mo |
How to Build a Clinic Dashboard in 3 Steps
Step 1. Export Data from Your HIS
Export from MEDIALOG ("Analytics → Doctor Utilization"), Infoclinica (Report Generator → Excel export), or 1C-Medicine ("Services by Patient" → CSV). Required columns: date, physician, specialty, patient type (new/returning), service, amount.
Step 2. Describe Your Metrics in AI Chat
Upload the file to @coderboxbot and type: "Build a clinic dashboard: doctor utilization by day, primary-to-repeat conversion, average revenue by department, revenue trend, top services." The AI suggests visualizations and KPI cards automatically.
Step 3. Get a Dashboard with Auto-Refresh
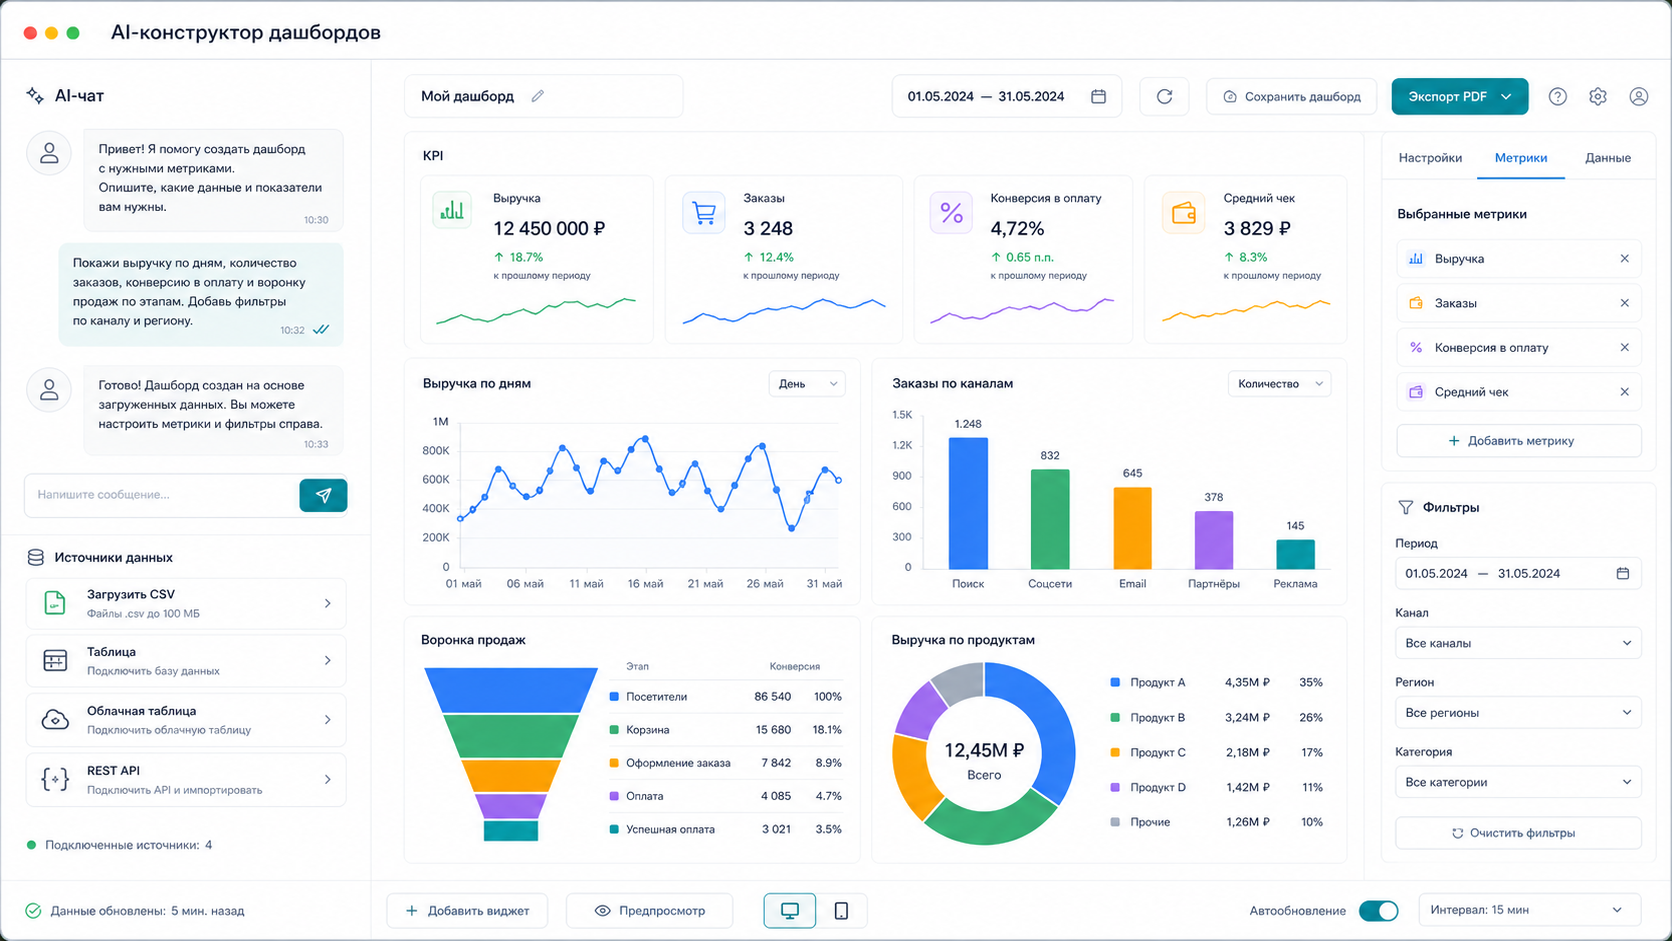
In 1-3 minutes — an interactive dashboard: utilization charts, a primary→repeat funnel, physician revenue comparison, and average revenue per specialty. Data updates daily without administrator involvement.
What a Medical Clinic Dashboard Shows
| Metric | What It Reveals |
|---|---|
| Doctor utilization | % occupancy per physician by day — identifies overloaded and underused specialists |
| Primary-to-repeat conversion | Share of patients returning after first visit — top service quality indicator |
| Average revenue per specialty | Revenue per visit by department — guides pricing decisions |
| Appointment funnel | Call → booking → attendance → return visit — where patients drop off |
| Revenue dynamics | Revenue by day, week, physician, and service with trend lines |
| Top services | Which services generate 80% of revenue and which are loss-making |
See Also
- Dental Clinic Dashboard 2026: Chair Utilization, Revenue and Bookings Without CRM
- Financial Dashboard 2026: Track Revenue, Expenses and Profit in Real Time
- KPI Dashboard 2026: Set Up Key Metrics Monitoring Without a BI Analyst
- Director Dashboard 2026: All Business Metrics on One Screen
Frequently Asked Questions
What data do I need for a clinic dashboard?
The minimum is an HIS export with fields: date, physician, specialty, patient type (new/returning), service, amount. MEDIALOG, Infoclinica, and 1C-Medicine support this export in standard mode — no special configuration required.
Is it safe to upload patient data?
Data is uploaded to your own server and is not transferred to third-party clouds. This complies with Russian Federal Law No. 152-FZ on personal data protection.
How is this different from built-in MEDIALOG reports?
Built-in HIS reports show data within a single system. SimpleDashboard lets you combine data from your HIS, 1C, and any other source, build conversion funnels, and track metrics in real time — without a programmer or BI analyst.
Price — $50/mo. Message @coderboxbot — we'll build a dashboard for your data.
Article prepared by the SimpleDashboard team. Updated: 2026-03-13.
Sources: - https://statum.pro — end-to-end business analytics for medical clinics - https://ingate.ru/uslugi/skvoznaya-analitika-meditsinskih-klinik/ — cross-channel analytics for clinics - https://www.medialog.ru/ — MEDIALOG HIS: utilization analytics and reporting - https://sdsys.ru/products/infoclinica/ — Infoclinica HIS: report generator and OLAP analytics - https://sobakapav.ru/portfolio/costa/ — case study: dashboard design for a hospital chief physician
The article "Medical Clinic Dashboard 2026: Doctor Utilization, Appointment Conversion, Revenue pe…" is AI-assisted and reviewed by Alexander Ruin, founder of onout.org. Updated: 2026-05-01.
About the service "Medical Clinic Dashboard 2026: Doctor Utilization, Appointment Conversion, Revenue per Service"
Medical Clinic Dashboard 2026: Doctor Utilization, Appointment Conversion, Revenue per Service. A head physician at a multi-specialty clinic discovers problems only after the...