
Manufacturing Dashboard 2026: OEE, Equipment Downtime & Production Plan vs Actual
Shop floor managers don't see OEE in real time — they learn about losses after the fact. Downtime is recorded in a notebook or Excel with no root-cause categories. Plan vs actual output is calculated manually once a week: by Friday the numbers are already stale. According to McKinsey, industrial companies lose up to 25% of productivity due to unplanned stoppages that are caught too late.
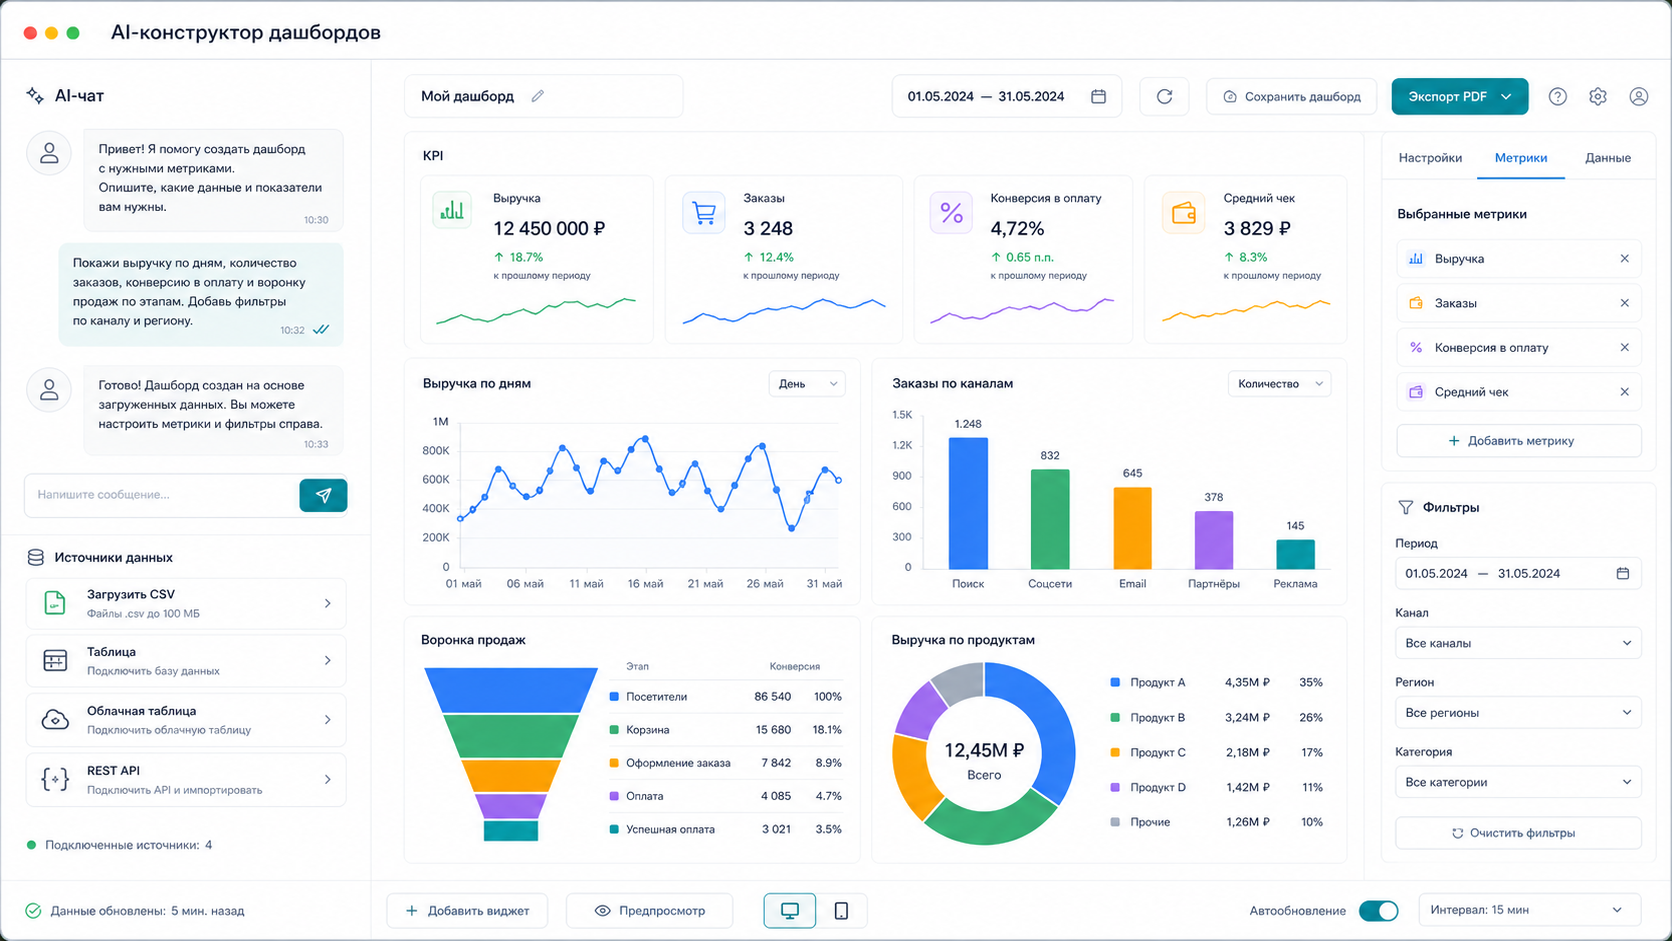
Key facts
- Industrial companies lose up to 25% of productivity due to unplanned stoppages caught too late (McKinsey)
- OEE is the core manufacturing KPI; without a dashboard it is calculated manually once a week
- SimpleDashboard builds a manufacturing dashboard in 3-5 minutes from a CSV or Excel shift report
- Auto-update on file upload or via API from ERP/MES — no manual work required
We benchmarked the dashboard-for-production topic against similar pages in the catalog and kept the wording focused on implementation details instead of repeating vendor marketing claims.
Key Metrics for a Manufacturing Dashboard
| Metric | What it shows | Visualization |
|---|---|---|
| OEE | Availability × Performance × Quality | Gauge + trend line |
| Equipment downtime | Duration, cause, machine, shift | Table + Pareto chart |
| Plan vs actual output | Units/tons — target vs actual by shop and shift | Bar chart with variance highlight |
| Scrap / defect rate | % of non-conforming product | KPI card with threshold |
| Machine utilization | % of planned run time actually used | Horizontal bar chart |
| Output by shift | Shift 1 / 2 / 3 comparison | Line or grouped bar chart |
Tool Comparison
| Tool | Setup time | Specialist needed | Auto-update | Cost |
|---|---|---|---|---|
| Excel | 8-20 h/week | Pivot table skills | No | Free |
| MES system | 3-12 months | Integrator + PLC engineer | Yes | from $5,500 |
| ERP / 1C-MES | 2-6 months | 1C implementation partner | Yes | from $2,200 |
| SimpleDashboard | 3-5 min | None | Yes | $50/mo |
3 Steps to a Manufacturing Dashboard
Step 1. Upload your shift and downtime data
Send SimpleDashboard an export from your system or an Excel file: shifts, equipment, plan, actual, downtime minutes, stoppage reasons. The AI recognises columns automatically — date, shift, line, plan, actual, downtime (min), cause, scrap (units).
Step 2. Describe the dashboard in plain text
Write:
"Shop floor dashboard: OEE by line for the week, downtime Pareto by cause category, plan vs actual output by shift, scrap percentage"
The AI selects the right visualisations: a gauge for OEE with an 85% threshold, a Pareto chart for downtime, and a plan vs actual bar chart with variance highlighting.
Step 3. Get your dashboard
In 1-3 minutes — an interactive panel: - Operational screen for the shift supervisor — OEE and downtime for the current shift - Analytics for the production director — weekly plan vs actual, OEE trend - Filters — by line, shift, machine, period - Auto-update on new file upload or via API from your ERP / MES
See Also
- CEO Dashboard: all business KPIs on one screen
- Financial Dashboard: revenue, costs and profit
- Warehouse Management: simple program without ERP
FAQ
How is OEE calculated in the dashboard?
OEE = Availability × Performance × Quality. Availability = actual run time / planned production time. Performance = actual output / theoretical maximum output. Quality = good units / total units produced. You need a file with columns: shift, plan, actual, downtime (min), scrap (units). The AI derives OEE per line and plots the trend automatically.
Can I connect an ERP or MES system to the dashboard?
Yes. If your system exports data to CSV or Excel, configure an automatic file upload and the dashboard refreshes without manual work. If you have a REST API or webhook, the dashboard updates in real time.
Does it work for a small production facility (1-5 lines)?
Yes — that is the ideal scale. No industrial MES required; a shift report spreadsheet in Excel with columns for shift, line, plan, actual, and downtime is enough.
A manufacturing dashboard in 2026 is not a six-month rollout. SimpleDashboard turns shift reports and downtime logs into a working panel for the shop floor supervisor and production director — in minutes.
Price — $50/mo. Message @coderboxbot — we'll build a dashboard for your data.
Learn more about all features on the SimpleDashboard page.
SimpleDashboard Team. Updated: 2026-03-13.
Sources: - Typical manufacturing dashboards: key metrics — fanruan.ru - Production manager dashboard: plan vs actual line — spivak.ru - OEE — the key equipment effectiveness metric — terpo.ru - KPI dashboard for industrial company executives — data.korusconsulting.ru
For "Manufacturing Dashboard 2026: OEE, Equipment Downtime & Production Plan vs Actual", AI assistance was used for structure and fact-check prompts; Alexander Ruin, founder of onout.org reviewed the final copy. Updated: 2026-05-01.
About the service "Manufacturing Dashboard 2026: OEE, Equipment Downtime & Production Plan vs Actual"
Build a production floor dashboard in minutes — no SQL, no MES rollout. OEE, downtime reasons, plan vs actual output on one screen. Compare Excel, MES and AI builder.