
Restaurant Dashboard 2026: Sales Analytics, Margins and Hourly Traffic
Every evening a restaurant owner tallies up the day in their head: "We seemed busy, but how much did we actually earn?" Dish margins are guesswork, food costs creep up, and which menu items are losing money remains unclear. Once you exceed 200+ receipts per day, manual tracking breaks down: errors accumulate and dish margins are calculated once a month instead of daily.
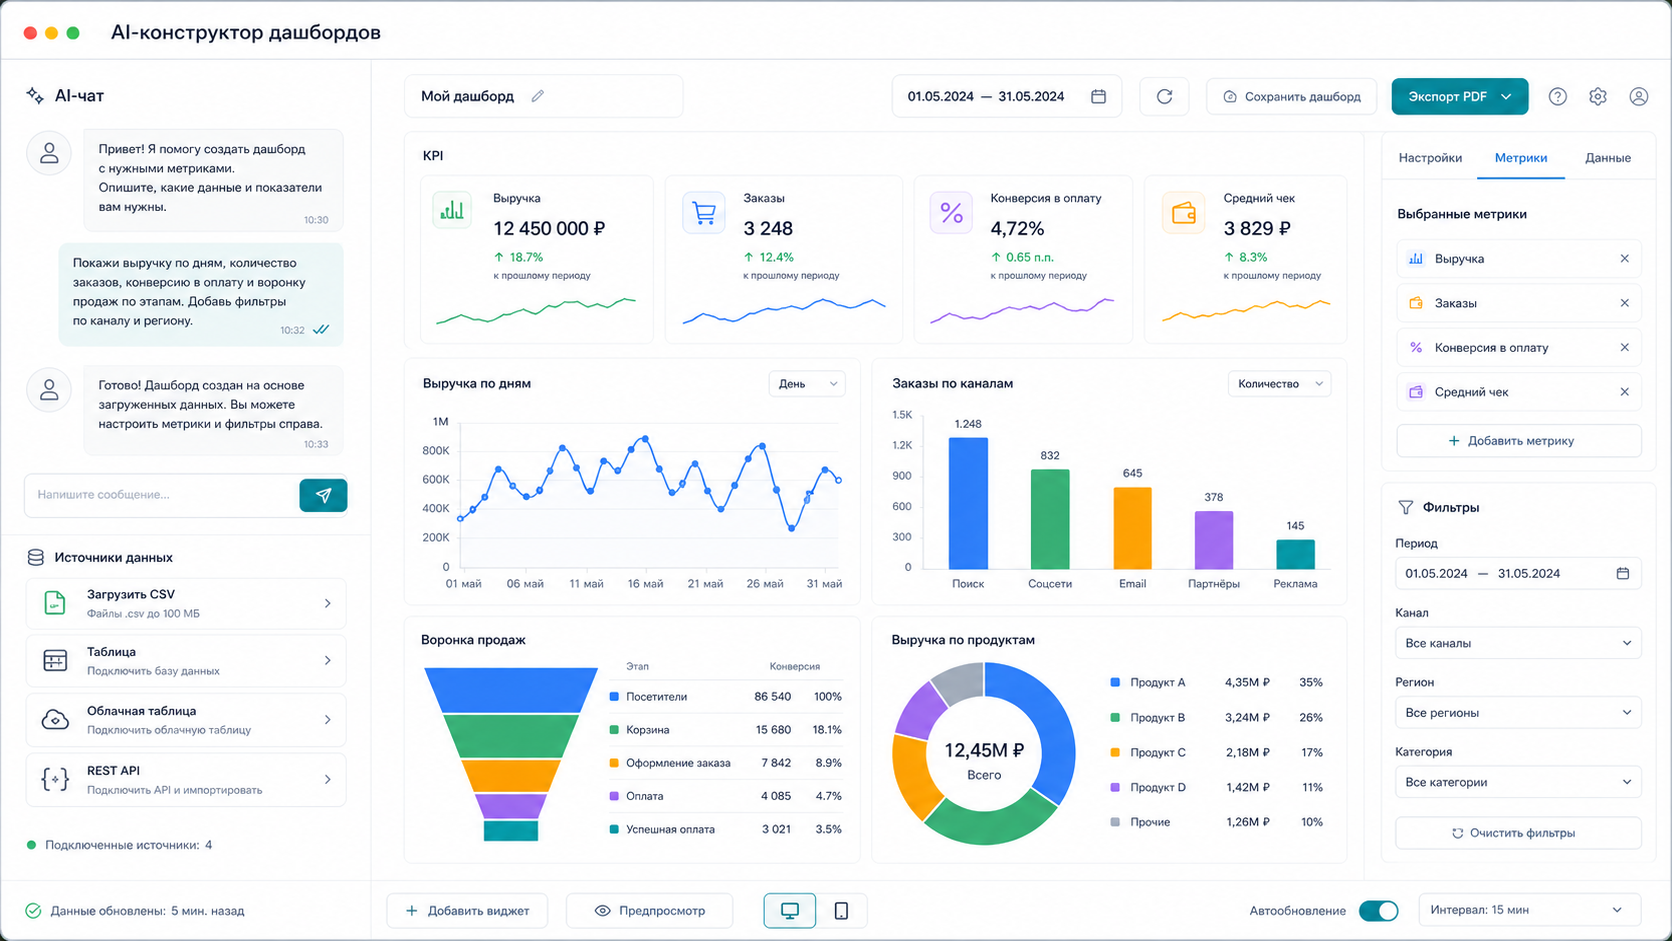
Key facts
- Average restaurant food cost should not exceed 25-30% of revenue — without a dashboard, overruns go unnoticed
- ABC menu analysis automatically groups dishes into profitable (A), average (B) and underperforming (C)
- At 200+ receipts per day, manual tracking produces errors in 15-20% of calculations
- SimpleDashboard builds a restaurant dashboard in 1-3 minutes from CSV, Excel, or POS system data
In our experience auditing the page "Restaurant Dashboard 2026: Sales Analytics, Margins and Hourly Traffic", the useful angle is not another generic platform list, but the operating decision: costs, data export, access rules, and support workload for simple dashboard.
Comparing Methods: How to Track Restaurant Analytics?
| Method | Pros | Cons | Price |
|---|---|---|---|
| Manual Excel | Free, familiar | Errors, no auto-refresh, 2-4 hours/day | Free |
| Built-in POS analytics (iiko, R-Keeper, Toast) | Data already in the system | Limited visuals, no custom metrics | $30-150/mo |
| BI system (Power BI, Tableau) | Flexible, powerful visualization | Requires BI analyst, 2-4 weeks setup | $220-$1,100/month |
| SimpleDashboard (AI) | No programmer, ready in minutes | Need a data export | $50/mo |
How to Build a Restaurant Dashboard in 3 Steps?
Step 1. Export Data from Your POS System
Export sales from iiko, R-Keeper, Poster, Toast, or any POS into CSV or Excel. Required columns: date, time, dish name, category, quantity, revenue, cost of goods.
Step 2. Describe the Metrics You Need in the AI Chat
Upload the file to SimpleDashboard and type: "Build a restaurant dashboard: daily revenue, food cost, margin per dish, ABC menu analysis, hourly guest traffic." The AI will suggest the right charts.
Step 3. Get a Ready-Made Dashboard with Filters
In 1-3 minutes — an interactive dashboard: revenue charts, KPI cards with trends, a dish profitability table and an hourly traffic heatmap. Filter by dates, categories, and staff.
What Does a Restaurant Dashboard Show?
| Metric | What It Shows |
|---|---|
| Real-time food cost | Share of ingredient costs in revenue — flags overspending |
| ABC menu analysis | Which dishes drive 80% of profits and which are loss-makers |
| Hourly traffic | Peak and dead hours — optimize staff scheduling |
| Average check | Check size trends by day, week, and server |
| Server KPIs | Revenue and average check per staff member |
See Also
- Sales Analytics 2026: How to Calculate KPIs and Build Reports in 5 Minutes
- Sales Dashboard 2026: 7 Essential Metrics and How to Track Them
- Financial Dashboard 2026: Track Revenue, Expenses and Profit in Real Time
- Business Expense Tracking 2026: Automated Cost Control
Frequently Asked Questions
What data do I need for a restaurant dashboard?
At minimum — a sales export from your POS system in CSV or Excel: date, dish, quantity, revenue, cost. More data means deeper analytics.
Can I connect data from my POS automatically?
Yes. SimpleDashboard supports REST API and webhook connections. Data refreshes automatically without manual exports.
What is ABC menu analysis?
ABC analysis groups dishes into three tiers: group A (20% of dishes generate 80% of profit), B (15%), C (5%). Helps remove unprofitable items and boost sales of high-margin dishes.
Stop calculating restaurant margins in your head — build a dashboard in 5 minutes. SimpleDashboard creates restaurant analytics via AI chat: upload your POS export, describe the metrics you need and get a ready-made dashboard without a programmer.
Price — $50/mo. Message @coderboxbot — we'll build a dashboard for your data.
Learn more about features — on the SimpleDashboard page.
Article prepared by the SimpleDashboard team. Updated: 2026-03-06.
Sources: - https://kurs.alfabank.ru/articles/restoran-v-cifrah-klyuchevye-pokazateli-ehkonomiki/ - https://joinposter.com/post/foodcost-v-restorane - https://lemma-group.ru/articles/abc-analiz-menyu-v-iiko/ - https://vc.ru/topovik/2739614-avtomatizatsiya-restoranov-v-2026-godu-top-programmy-dlya-kafe-i-restoranov
AI-assisted editorial update for "Restaurant Dashboard 2026: Sales Analytics, Margins and Hourly Traffic"; final responsibility and review: Alexander Ruin, founder of onout.org. Updated: 2026-05-01.
About the service "Restaurant Dashboard 2026: Sales Analytics, Margins and Hourly Traffic"
Build a restaurant dashboard in 5 minutes: sales, food cost, dish margins, ABC menu analysis and hourly traffic. No programmer needed, via AI chat — $50/month.