
HR Analytics 2026: How to Track Turnover, Hiring and Employee Effectiveness
HR directors spend hours gathering data from scattered spreadsheets, while the final turnover report is already outdated by the time of the meeting. 67% of Russian companies use no more than five metrics, even as the HR-tech market grows 15–20% per year in 2026. An HR analytics dashboard lets you see everything in real time — without a programmer or BI specialist.
Key facts
- 65% of companies face staff shortages with unemployment at just 2.3% — retention has become critical
- 70% of HR leaders track only payroll, turnover and headcount — that is not enough
- Manual HR report collection takes 2–4 hours per week per HR analyst
- SimpleDashboard compiles HR analytics from CSV/Excel in 5 minutes without implementing an HRM system
During rollout planning for simple dashboard, the recurring issue was not feature quantity but whether a buyer could verify limits, exports, integrations, and ownership before committing.
Comparison: How to Manage HR Analytics?
| Method | Description | Pros | Cons | Price |
|---|---|---|---|---|
| Excel/Google Sheets | Manual tables and pivot reports | Free, flexible | No visualization, errors, time-consuming | Free |
| 1C:ZUP CORP | Built-in 1C analytics | Payroll integration | Complex setup, requires 1C specialist | from $550 |
| HRM platforms (Websoft, TalentRocks) | Full-cycle HR systems | Complete functionality | Long implementation (2–6 months), expensive | from $300/month |
| AI dashboard SimpleDashboard | Dashboard from your data via chat | Fast start, no code | No built-in payroll calculation | $50/mo |
How to Set Up HR Analytics in 3 Steps?
You can get a dashboard on turnover, hiring and HR effectiveness in one working session — without implementing an HRM system or hiring contractors.
Step 1. Prepare Your HR Data Export
Export from 1C, Excel or your HRM system: employee name, department, hire date, termination date (if applicable), position, salary. A CSV or XLSX file is enough.
Step 2. Describe the Metrics You Need in Chat
Message @coderboxbot: "Create an HR dashboard: turnover by department, time-to-fill vacancies, headcount coverage, monthly hiring trends." AI will suggest the optimal visualization for your data.
Step 3. Get an Interactive HR Dashboard
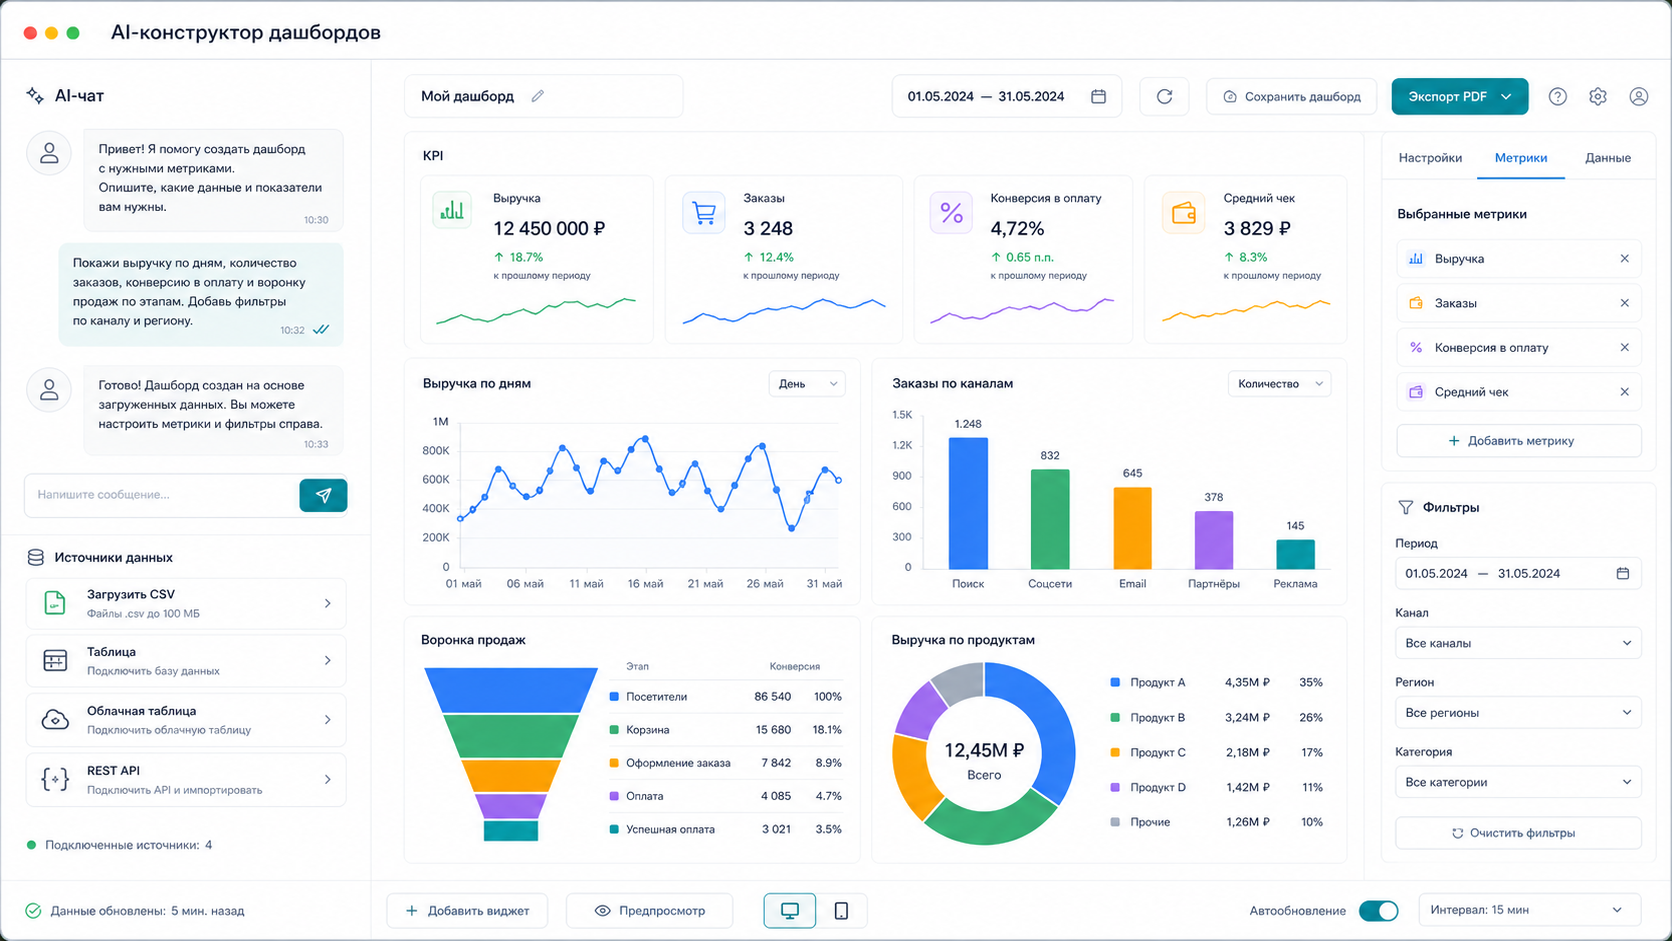
The finished dashboard will show: turnover rate by division, hiring funnel, KPI cards for headcount and coverage. Update data weekly and export a PDF report for management.
What Else Can SimpleDashboard Do for HR?
| Feature | What It Does |
|---|---|
| Turnover analysis | Rate by department, tenure, position — with trend over time |
| Hiring funnel | Recruitment metrics: time-to-hire, cost-per-hire, stage conversion |
| Talent pool analytics | Talent pipeline readiness — statuses and preparation timelines |
| Workforce KPIs | Headcount plan vs. actual, payroll, sick leave, overtime |
| Auto-refresh | Data updates on schedule via API or file upload |
See Also
- HR Analytics Dashboard 2026: Metrics for Workforce Management
- KPI Dashboard: Employee Performance Monitoring
- Employee Task Tracking: Dashboard for Managers
- Management Reports: Dashboard with Automatic Distribution
Frequently Asked Questions
What is HR analytics and why does an HR director need it?
HR analytics is the collection and visualization of workforce data: turnover, hiring, headcount, effectiveness. It allows decisions based on numbers, not intuition.
Can I build an HR dashboard without an HRM system?
Yes. An export from 1C, Excel or Google Sheets is enough. The AI dashboard is built from any CSV/XLSX file without integrations or programming.
How is the turnover rate calculated in the dashboard?
Automatically: number of employees who left during the period divided by average headcount, multiplied by 100. You can specify a custom formula via chat if you use your own methodology.
Is it suitable for talent pool analytics?
Yes. Specify readiness statuses for your talent pipeline in chat — the dashboard will show who is ready for appointment, who is in preparation, and which key positions remain unfilled.
Stop collecting HR reports manually. SimpleDashboard builds a turnover, hiring and personnel KPI dashboard in 2026 — in 5 minutes, without a programmer.
Price — $50/mo. Message @coderboxbot — we'll build a dashboard for your data.
Learn more about features on the SimpleDashboard page.
Article prepared by the SimpleDashboard Team. Updated: March 2026.
Sources: - https://practicum.yandex.ru/blog/chto-takoe-hr-analitika/ - https://www.kommersant.ru/doc/8361664 - https://www.diasoft.ru/about/publications/22038/ - https://skillbox.ru/media/management/kakie-zadachi-reshayut-s-pomoshchyu-hranalitiki-i-kak-vnedrit-eye-v-kompanii/ - https://spectrumdata.ru/blog/proverka-soiskatelya/hr-analitika-dlya-biznesa-kak-dannye-o-sotrudnikakh-vliyayut-na-strategiyu-kompanii/ - https://v8.1c.ru/metod/article/kadrovyy-rezerv.htm
This simple_dashboard guide uses AI-assisted drafting and human editorial review by Alexander Ruin, founder of onout.org. Updated: 2026-05-01.
About the service "HR Analytics 2026: How to Track Turnover, Hiring and Employee Effectiveness"
HR analytics 2026: dashboard for tracking employee turnover, hiring funnel and KPIs. No programmer needed, ready in 5 minutes. $50/mo — setup included.