
Wildberries Analytics 2026: Free Sales, Stock & Ad Dashboard Without MPStats
MPStats starts at $55/mo, Moneyplace at $188/mo. Yet most Wildberries sellers only need their own analytics: how much was sold, what is sitting in the warehouse, and where the ad budget is going. Sellers spend 1–2 hours a day manually assembling data in Excel — though all of this can be built from standard WB seller account exports in 5 minutes.
Key facts
- MPStats and Moneyplace analyse competitors — they don't give you a consolidated P&L of your own data
- Built-in WB analytics doesn't merge financials, warehouse, and ads on one screen
- SimpleDashboard analyses your own WB data without API — just standard CSV exports from the seller account
- Data stays on your own server — no API keys or financial reports sent to third-party clouds
We benchmarked the wildberries-analytics-dashboard topic against similar pages in the catalog and kept the wording focused on implementation details instead of repeating vendor marketing claims.
Why the Built-in WB Analytics Falls Short
The Wildberries seller account shows basic numbers but does not give you the full picture:
- Sales and revenue are shown without breakdown by warehouse or promotion channel
- Ad analytics (CTR, CPC, ROAS) requires manual consolidation from a separate ad cabinet
- Stock is visible by SKU, but there is no forecast of days until stockout or reorder recommendations
- No single screen: financials, warehouse and ads are in three separate sections
How Much Do WB Analytics Services Cost in 2026?
| Service | Minimum Plan | What You Get |
|---|---|---|
| Built-in WB Analytics | $0 (basic) / paid for extended reports | Basic metrics without consolidation |
| MPStats | from $55/mo | External analytics + competitors + niches |
| Moneyplace | from $188/mo | All-in-one with AI features |
| MarketGuru | from $33/mo | Competitor and niche analysis |
| SimpleDashboard AI | $50/mo | Your own data: sales + stock + ads |
The key difference with SimpleDashboard: it analyses your own data from the WB seller account, not the external market. If the goal is to see P&L, ROAS and stock levels on one screen rather than tracking competitors, it is cheaper and simpler.
3 Steps: From CSV to Dashboard in 5 Minutes
Step 1. Export Reports from Your WB Seller Account
In the Analytics section of the Wildberries seller account, download three files:
- Sales: Analytics → Financial Reports → Sales Report (CSV)
- Stock: Analytics → Warehouse → Product Stock (Excel)
- Advertising: Ads → Campaign Statistics → Export (Excel)
Step 2. Upload the Files and Describe the Dashboard
Open @coderboxbot, upload the files and type: "Build a WB dashboard: revenue and orders by week, top 10 products by sales, stock levels with days-to-stockout forecast, ROAS by ad campaign."
Step 3. Get Ready Analytics
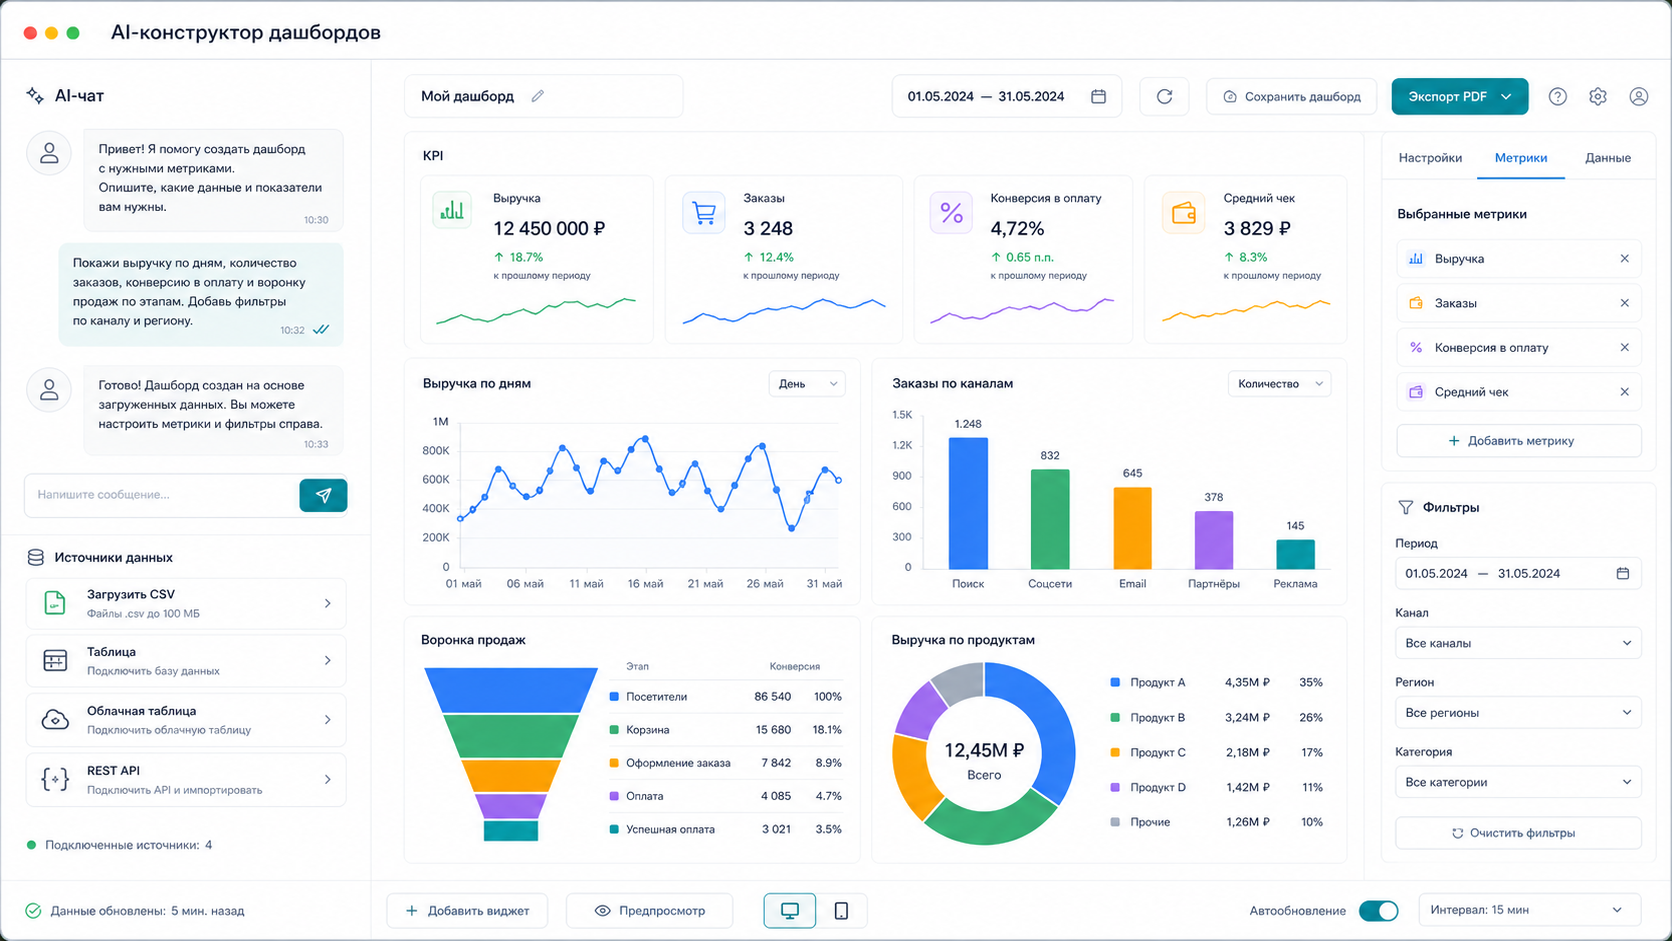
The AI will merge all three data sources and create an interactive dashboard: KPI cards (revenue, orders, average order value, redemption rate, ROAS), weekly sales trend, stock table with "running low" alerts, and ad analytics per campaign.
Frequently Asked Questions
Does it require the Wildberries API?
No. Standard CSV or Excel exports from the WB seller account are enough — no tokens or technical setup needed. The API can be connected optionally for automatic data refresh.
How is this different from MPStats?
MPStats specialises in external market analytics: competitor data, niches, SEO rankings. SimpleDashboard analyses your own sales, stock and ad performance. If you need to see your own P&L and ROAS, SimpleDashboard is cheaper and requires no setup.
Can the dashboard update automatically?
Yes. Connect the Wildberries API once and the dashboard refreshes automatically on a schedule. Without the API, update by uploading a new export — this takes 1–2 minutes.
What other data sources are supported?
Ozon, Yandex Market, Google Sheets, CRM systems (AmoCRM, Bitrix24), any REST API. Data from multiple marketplaces can be combined in one dashboard.
See Also
- Ozon and Wildberries Analytics 2026: Comparing Two Marketplaces on One Dashboard
- Marketplace Analytics 2026: Combined Dashboard for Ozon, WB, Yandex Market
- Dashboard from CSV and Excel 2026: Upload a Spreadsheet, Get Analytics in 5 Minutes
- KPI Dashboard 2026: How to Set Up Key Metrics Monitoring
Price — $50/mo. Message @coderboxbot — we'll build a dashboard for your data.
Alexander Ruin, founder of onout.org. Updated: April 2026.
Sources: - https://mpstats.io/ - https://www.moysklad.ru/poleznoe/marketplejsy/analitika-wildberries/ - https://www.kp.ru/money/biznes/luchshie-servisy-analitiki-wildberries/ - https://seller.wildberries.ru/instructions/ru/ru/material/data-report - https://selsup.ru/blog/servisy-analitiki-marketplejsov-2024-sravnili-mpstats-moneyplace-marketguru-mayak-sellerfox-i-selsup/
The article "Wildberries Analytics 2026: Free Sales, Stock & Ad Dashboard Without MPStats" is AI-assisted and reviewed by Alexander Ruin, founder of onout.org. Updated: 2026-05-01.
About the service "Wildberries Analytics 2026: Free Sales, Stock & Ad Dashboard Without MPStats"
Wildberries Analytics 2026: Free Sales, Stock & Ad Dashboard Without MPStats. MPStats starts at $55/mo, Moneyplace at $188/mo. Yet most Wildberries sellers only need their...