
SaaS Metrics Dashboard 2026: MRR, Churn and LTV in 5 Minutes Without Baremetrics
Baremetrics starts at $108/month, ChartMogul at $100/month. Even at $3,000 MRR you pay a third of monthly revenue for an analytics tool. Both require direct Stripe or Paddle integration — without a connector there is no dashboard. An AI dashboard with the same metrics builds from a CSV in 5 minutes without any integrations.
Key facts
- Reducing Churn from 5% to 3% increases LTV by 66% — one metric that changes everything
- Baremetrics and ChartMogul require a direct connector to Stripe/Paddle — no connector, no dashboard
- An AI dashboard builds from any transaction CSV in 5 minutes — billing service does not matter
- For an early-stage startup, the difference vs Baremetrics is $100+/month = $1,200+/year
Our data shows that readers of "SaaS Metrics Dashboard 2026: MRR, Churn and LTV in 5 Minutes Without Baremetrics" need a practical buying checkpoint, so this section separates subscription cost, migration risk, and day-to-day administration for the saas-metrics-dashboard scenario.
Key SaaS Metrics and Formulas
MRR = active subscribers × ARPU. Breaks into New MRR (new customers), Expansion MRR (upgrades), Churn MRR (cancellations).
Churn Rate = cancelled / total active × 100%. Benchmark for B2B SaaS: 3–5%/month at growth stage.
LTV = ARPU / Churn Rate. At ARPU $40 and Churn 5% → LTV = $800. Cut Churn to 3% → LTV = $1,333 (+66%).
CAC / LTV: healthy ratio is LTV / CAC > 3. At LTV = $800, CAC should not exceed $267.
SaaS Analytics Tool Comparison
| Tool | Pros | Cons | Price |
|---|---|---|---|
| Excel / Google Sheets | Free, full control | Manual recalculation, no charts, error-prone | $0 |
| Baremetrics | Auto-calc from Stripe, clean UI | $108/mo even at $10K MRR, requires connector | $108–$358+/mo |
| ChartMogul | Cohort analysis, segmentation | $100/mo, complex integration setup | $100–$500+/mo |
| ProfitWell | Free basic tier | Only Paddle/Stripe, limited metrics | $0–$200/mo |
| SimpleDashboard AI | Ready in 5 min from CSV | No direct billing integration | $50/mo |
How to Build a SaaS Metrics Dashboard in 3 Steps
Step 1. Prepare Your Data
Export transactions from Stripe, Paddle, or your internal CRM to CSV. Required columns: date, customer_id, plan, amount, status (active / cancelled).
Step 2. Describe the Dashboard in Chat
Open @coderboxbot and write: "SaaS metrics dashboard: MRR and ARR by month, Churn Rate, LTV by plan, ARPU, active customers, new vs cancelled. 12-month trend."
Step 3. Get Ready Analytics
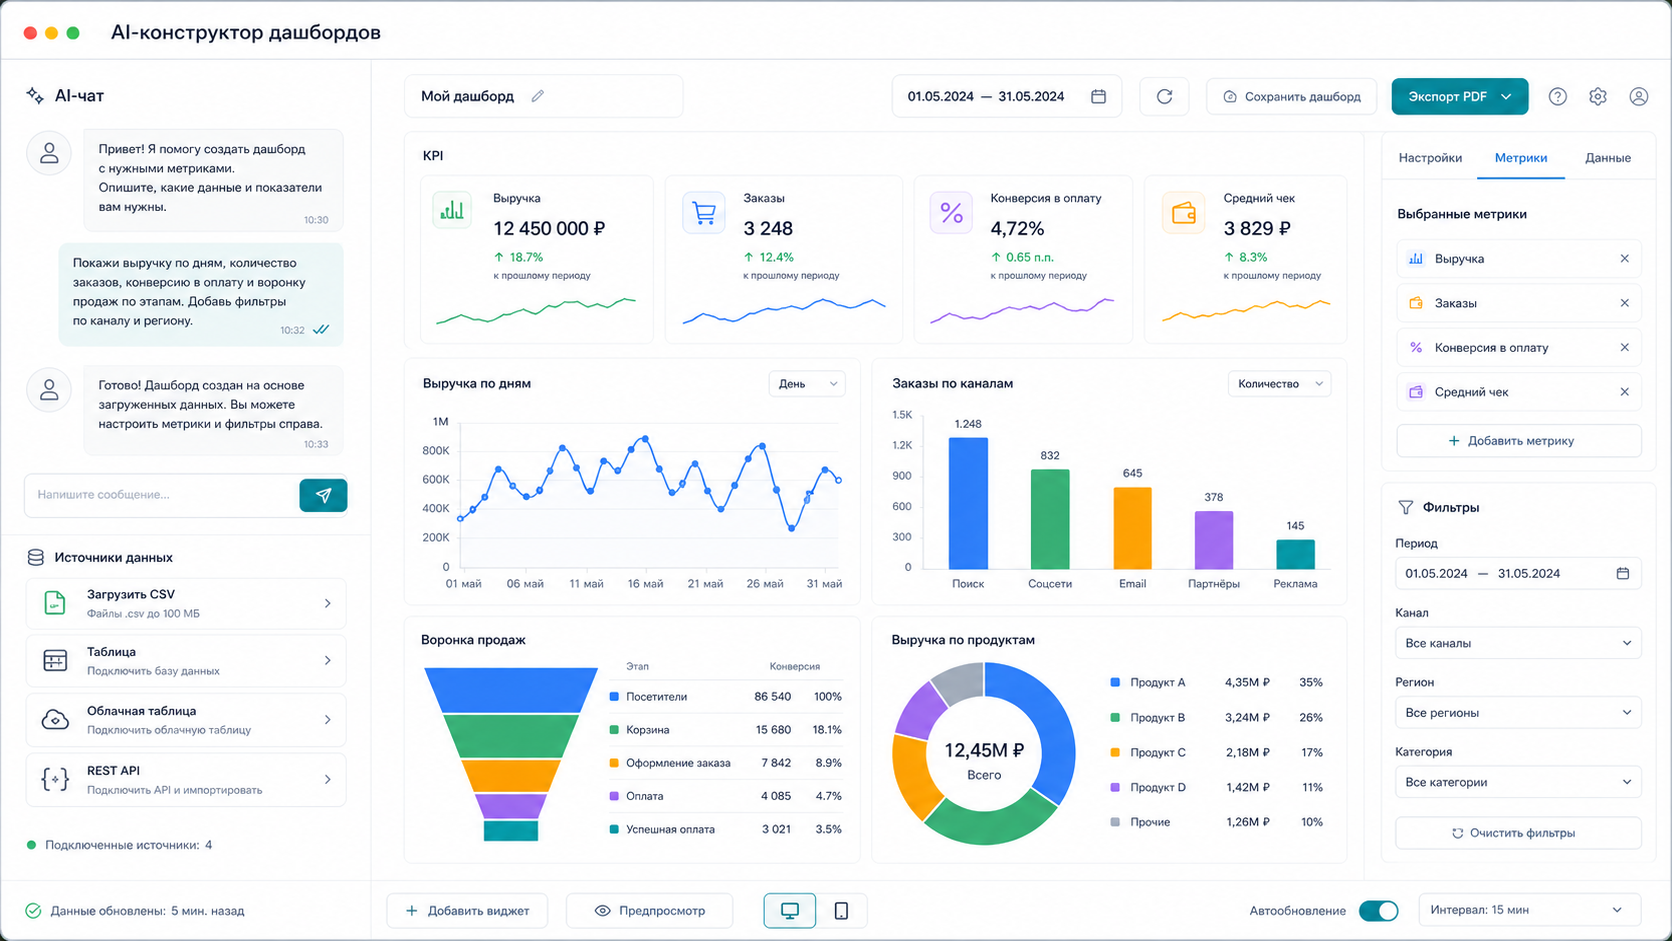
In 1–3 minutes you get a dashboard with: MRR line chart broken by components (New / Expansion / Churn), ARR and ARPU KPI cards, Churn Rate gauge with benchmark zones, LTV table by pricing plan, and cohort retention heatmap.
See Also
- Subscription Analytics 2026: Dashboard for SaaS Business
- Financial Dashboard 2026: Revenue, Expenses and Profit
- Morning Dashboard: All Business Metrics on One Screen
Frequently Asked Questions
What is the difference between MRR and ARR?
MRR is monthly recurring revenue. ARR = MRR × 12. ARR is useful for investor conversations; MRR is for day-to-day operations.
Do I need to connect Stripe or Paddle?
No. Export transactions from any billing system to CSV. No API connectors needed — this is the key difference from Baremetrics and ChartMogul.
How do I calculate LTV with less than 12 months of data?
Use LTV = ARPU / Churn Rate. With 3 months of data and 6% Churn → LTV = ARPU / 0.06. As data accumulates, the dashboard will automatically refine the number.
Price — $50/mo. Message @coderboxbot — we will build a dashboard for your data.
Learn more on the SimpleDashboard page.
Alexander Ruin, founder of onout.org. Updated: April 2026.
Sources: - https://baremetrics.com/blog/baremetrics-vs-chartmogul-vs-profitwell - https://www.quantledger.app/blog/baremetrics-vs-chartmogul - https://chartmogul.com/ - https://www.mrrsaver.com/blog/saas-churn-rate-benchmarks - https://www.hubifi.com/blog/saas-analytics-dashboard-guide
Created with AI tool support for outline and consistency checks; reviewed by Alexander Ruin, founder of onout.org for onout.org. Updated: 2026-05-01.
About the service "SaaS Metrics Dashboard 2026: MRR, Churn and LTV in 5 Minutes Without Baremetrics"
Track MRR, Churn and LTV without Baremetrics ($108/mo) or ChartMogul ($100/mo). AI SaaS metrics dashboard in 5 minutes from CSV. No developer needed. $50/mo.